. 2012 Sep;5(5):501-12.
doi: 10.1038/mi.2012.23. Epub 2012 Apr 11.

Targeted deletion of MyD88 in intestinal epithelial cells results in compromised antibacterial immunity associated with downregulation of polymeric immunoglobulin receptor, mucin-2, and antibacterial peptides

Affiliations
Free PMC article

Targeted deletion of MyD88 in intestinal epithelial cells results in compromised antibacterial immunity associated with downregulation of polymeric immunoglobulin receptor, mucin-2, and antibacterial peptides

A L Frantz et al. Mucosal Immunol. 2012 Sep.
Free PMC article

Abstract

Intestinal epithelial cells (IECs) form a physical and immunological barrier that separates the vast gut microbiota from host tissues. MyD88-dependent Toll-like receptor signaling is a key mediator of microbial-host cross-talk. We examined the role of epithelial MyD88 expression by generating mice with an IEC-targeted deletion of the Myd88 gene (MyD88(ΔIEC)). Loss of epithelial MyD88 signaling resulted in increased numbers of mucus-associated bacteria; translocation of bacteria, including the opportunistic pathogen Klebsiella pneumoniae, to mesenteric lymph nodes; reduced transmucosal electrical resistance; impaired mucus-associated antimicrobial activity; and downregulated expression of polymeric immunoglobulin receptor (the epithelial IgA transporter), mucin-2 (the major protein of intestinal mucus), and the antimicrobial peptides RegIIIγ and Defa-rs1. We further observed significant differences in the composition of the gut microbiota between MyD88(ΔIEC) mice and wild-type littermates. These physical, immunological, and microbial defects resulted in increased susceptibility of MyD88(ΔIEC) mice to experimental colitis. We conclude that MyD88 signaling in IECs is crucial for maintenance of gut homeostasis.


Figures

Figure 1
Figure 1
Targeted deletion of MyD88 in intestinal epithelial cells (IECs) results in increased numbers of mucus-associated bacteria and bacterial translocation to mesenteric lymph nodes (MLNs). (a) Mice with a targeted deletion of the Myd88 gene in IECs (MyD88ΔIEC) were created by crossing mice in which both copies of the MyD88 gene were flanked with loxP sites (MyD88Flox) with mice expressing Cre recombinase under the control of the IEC-specific Vil1 promoter. Levels of MyD88 mRNA were analyzed in colonic epithelial cells isolated from 9-week-old littermate MyD88Flox and MyD88ΔIEC mice by Nanostring nCounter hybridization. mRNA transcript abundance was normalized as described in the Methods section, and expressed as mean±s.e.m. (n=15). (b) Colon tissue sections from MyD88Flox and MyD88ΔIEC mice were stained with hematoxylin and eosin (upper panels) or fluorescein isothiocyanate–labeled antibodies to MyD88 (green) and the nuclear stain 4,6-diamidino-2-phenylindole (blue; lower panels). (c) Bacterial colony-forming units (CFU) were enumerated following anaerobic culture of fecal homogenates (CFU per g feces), luminal washes (CFU per ml phosphate-buffered saline), and surface mucus (CFU per 100 μl mucus) from colons of MyD88Flox and MyD88ΔIEC mice. Data are expressed as mean±s.e.m. (n=6). (d) Bacterial colonies cultured under anaerobic conditions from MLNs of representative MyD88Flox and MyD88ΔIEC mice. Large mucoid colonies from MyD88ΔIEC mice were identified as Klebsiella pneumoniae (Kp) by sequence analysis of 16S rRNA genes and biochemical tests (see Supplementary Figure S3 online). (e) CFU of total anaerobic bacteria and K. pneumoniae cultured from MLNs of MyD88Flox and MyD88ΔIEC mice. Data in the bar graph are expressed as CFU per MLN (mean±s.e.m., n=27). The numbers below the bar graph indicate the percentage of mice of each genotype from which bacteria (total and K. pneumoniae) could be cultured from MLNs. In all panels, asterisks indicate that the mean for MyD88ΔIEC mice is significantly different from the mean for MyD88Flox mice (P<0.05).
Figure 2
Figure 2
Loss of MyD88 expression in intestinal epithelial cells (IECs) compromises epithelial barrier integrity. (a) Epithelial barrier function. Transmucosal electrical resistance (TER) was analyzed ex vivo in isolated mouse colon tissues placed in Ussing chambers. Data are expressed as means±s.e.m. (n=8). (b) Association of exogenous, noninvasive bacteria with colonic mucus. MyD88Flox and MyD88ΔIEC mice were administered Escherichia coli strain Nissle 1917 that had been transformed to kanamycin resistance (KanR E. coli) at a dose of 2.5 × 10⁷ CFU ml−1 in the drinking water for 7 days. Kanamycin-resistant colonies were enumerated after anaerobic culture of fecal homogenates (colony-forming units (CFU) per g feces), luminal washes (CFU per ml phosphate-buffered saline), and epithelial-associated mucus (CFU per 100 μl mucus). Data are expressed as mean±s.e.m. (n=6). (c) Antibacterial activity of colonic mucus. Aliquots of mucus harvested from the colons of MyD88Flox and MyD88ΔIEC mice were incubated for 15 min with 106 CFU of KanR E. coli, and then cultured in the presence of kanamycin to enumerate surviving E. coli. Data are expressed as mean±s.e.m. (n=6). (d) In vitro bacterial invasion assays. Clones of the HT-29 human colon carcinoma cell line were stably transfected with small hairpin RNA (shRNA) specific for MyD88 or a random control sequence. Cell monolayers (2 cm2) were incubated with 106 CFU (MOI of 10:1) of E. coli strain Nissle 1917, a strain of Klebsiella pneumoniae isolated from mesenteric lymph nodes of MyD88ΔIEC mice, or Salmonella typhimurium strain SL1344. Membrane-bound CFU were enumerated by anaerobic culture of cell homogenates after washing to remove unbound bacteria, and intracellular CFU were enumerated in parallel plates after 2 h of treatment of cell monolayers with gentamicin to kill all extracellular bacteria. Data are expressed as mean±s.e.m. (n=6). Asterisks indicate that the mean for MyD88ΔIEC mice is significantly different from the mean for MyD88Flox mice (panels a–c) or that the mean for cells expressing MyD88 shRNA is significantly different from the mean for cells expressing control shRNA (d) (P<0.05).
Figure 3
Figure 3
Differences in the composition of the fecal microbiota of MyD88Flox and MyD88ΔIEC mice. The relative abundance of operational taxonomic units (OTUs) was quantified by Phylochip microarray analysis of 16S rRNA gene sequences in fecal DNA from 4 MyD88Flox and 5 MyD88ΔIEC littermate mice (see the Methods section for details of data analysis). A representative 16S rRNA gene from each of 109 differentially expressed OTUs was aligned and used to infer the phylogenetic tree shown in this figure. The rings around the tree comprise a heatmap where the inner ring includes the samples from MyD88Flox mice, and the outer ring includes the samples from MyD88ΔIEC mice. Blue lines indicate that the OTU was more abundant in that sample than in the mean of MyD88Flox mice samples, and red lines indicate that the OTU was less abundant. The color saturation indicates the fold difference in OTU abundance for each mouse compared with the mean for MyD88Flox mice.
Figure 4
Figure 4
Loss of MyD88 expression in intestinal epithelial cells (IECs) is associated with changes in the composition of the fecal microbiota. (a) Principal component analysis (PCA) was used to generate two-dimensional ordination plots that visualize complex relationships between the fecal microbiota of individual MyD88Flox and MyD88ΔIEC mice, based on weighted Unifrac distances between operational taxonomic units (OTUs) detected in fecal samples. The graph on the left is based on 14,193 OTUs present in at least one mouse, and the graph on the right is based on 2,647 OTUs with significant differences in abundance between MyD88Flox and MyD88ΔIEC mice. (b) Significant OTUs that characterize the distinctive microbiota of MyD88Flox and MyD88ΔIEC mice were identified using the Prediction Analysis for Microarrays method. Data in the bar graph are expressed as fold difference (log2, mean±s.e.m.) in abundance between MyD88ΔIEC (n=5) and MyD88Flox mice (n=4). Bars to the right of the zero line represent distinctive OTUs that were more abundant in MyD88ΔIEC mice, all of which were classified in the candidate phylum TM7. Bars to the left represent distinctive OTUs that were more abundant in MyD88Flox mice, all of which were classified in the genus Lactobacillus (phylum Firmicutes). Numbers in parentheses on the y-axis are the IDs for individual OTUs (see Supplementary Table S1 online for complete taxonomy of the distinctive OTUs). (c) Relative abundance of five species of fecal bacteria in individual MyD88Flox and MyD88ΔIEC mice. Because each of these species (except Candidatus arthromitus) comprised multiple OTUs, the OTU that represented the biggest difference in abundance between MyD88Flox and MyD88ΔIEC mice is displayed.
Figure 5
Figure 5
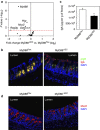
Loss of MyD88 expression alters epithelial gene expression and compromises polymeric immunoglobulin receptor (pIgR)–mediated immunoglobulin (Ig)A transport. (a) Colonic epithelial cells were isolated from 8-week-old MyD88ΔIEC and MyD88Flox mice (n=12). Levels of 36 individual mRNA transcripts were analyzed by Nanostring nCounter hybridization and plotted as mean fold difference (log2) between MyD88ΔIEC and MyD88Flox mice vs. P value (−log10). mRNA transcript levels for genes above the red dashed line were significantly different in MyD88ΔIEC mice compared with MyD88Flox mice (P<0.05). Genes to the left of the zero line were downregulated, whereas genes to the right were upregulated. (b) Immunofluorescence staining of colon tissues from 9-week-old MyD88Flox and MyD88ΔIEC mice (pIgR=red, IgA=green, 4,6-diamidino-2-phenylindole (DAPI)-stained nuclei=blue). (c) Feces were collected from 10-week-old MyD88Flox and MyD88ΔIEC mice and IgA levels were determined by enzyme-linked immunosorbent assay. Data are expressed as mean±s.e.m. (n=5). The asterisk indicates that the mean for MyD88ΔIEC mice is significantly different from the mean for MyD88Flox mice (P<0.05). (d) Immunofluorescence staining of colon tissues from 9-week-old MyD88Flox and MyD88ΔIEC mice (Muc2=red, DAPI-stained nuclei=blue). IEC, intestinal epithelial cells.
Figure 6
Figure 6
Loss of MyD88 expression in intestinal epithelial cells (IECs) increases the severity of dextran sulfate sodium (DSS)-induced colitis. (a) Disease activity in MyD88Flox and MyD88ΔIEC mice that were given regular drinking water or 2% DSS for 7 days. Data are expressed as mean±s.e.m. (n=8). One asterisk indicates that the mean for DSS-treated mice is significantly greater than the corresponding mean for untreated mice, and two asterisks indicate that the mean for DSS-treated MyD88ΔIEC mice is greater than the mean for DSS-treated MyD88Flox mice. (b) Colon histology from representative mice at day 7. Images of formalin-fixed colon tissues stained with hematoxylin and eosin were captured with a × 20 objective. (c) Histological inflammatory scores for MyD88Flox and MyD88ΔIEC mice on day 7. Data are expressed as mean±s.e.m. (n=8). Asterisks indicate that the means for DSS-treated mice are significantly different from the means for untreated mice of the same genotype, and that the mean for DSS-treated MyD88ΔIEC mice is significantly different from the mean for DSS-treated MyD88Flox mice (P<0.05). (d) Principal component analysis was used to generate two-dimensional ordination plots that visualize complex relationships in expression of multiple genes in colonic EC of individual MyD88Flox and MyD88ΔIEC mice, with or without DSS treatment. Normalized mRNA transcript levels for 19 genes were reduced to 2 PCs (see Supplementary Figure S9 online for details), which are plotted for individual mice. (e) Levels of 36 individual mRNA transcripts were measured by Nanostring nCounter hybridization. Data are plotted as mean fold difference (log2) between MyD88Flox mice with or without DSS treatment vs. P value (−log10; upper panel), and mean fold difference (log2) between DSS-treated MyD88ΔIEC and MyD88Flox mice vs. P value (−log10; lower panel). Individual dots represent the mean of treatment groups (n=8). mRNA transcript levels for genes above the red dashed line were significantly different for each comparison (P<0.05). Genes above the red dashed line were significantly different in DSS-treated mice compared to untreated mice (P<0.05). Genes to the left of the zero line were downregulated, and genes to the right were upregulated.

References

    1. Hooper L.V., Macpherson A.J. Immune adaptations that maintain homeostasis with the intestinal microbiota. Nat. Rev. Immunol. 2010;10,:159–169. - PubMed
    1. Carvalho F.A., Aitken J.D., Vijay-Kumar M., Gewirtz A.T. Toll-like receptor-gut microbiota interactions: perturb at your own risk! Annu. Rev. Physiol. 2011;74,:177–198. - PubMed
    1. Gill N., Wlodarska M., Finlay B.B. Roadblocks in the gut: barriers to enteric infection. Cell. Microbiol. 2011;13,:660–669. - PubMed
    1. Kaser A., Zeissig S., Blumberg R.S. Genes and environment: how will our concepts on the pathophysiology of IBD develop in the future. Dig. Dis. 2010;28,:395–405. - PMC - PubMed
    1. Cario E. Heads up! How the intestinal epithelium safeguards mucosal barrier immunity through the inflammasome and beyond. Curr. Opin. Gastroenterol. 2010;26,:583–590. - PubMed

Publication types

MeSH terms