. 2012 Jul;20(7):1434-42.
doi: 10.1038/mt.2012.60. Epub 2012 Apr 10.

In vivo tracking of mesechymal stem cells using fluorescent nanoparticles in an osteochondral repair model

Affiliations

In vivo tracking of mesechymal stem cells using fluorescent nanoparticles in an osteochondral repair model

Jong Min Lee et al. Mol Ther. 2012 Jul.

Abstract

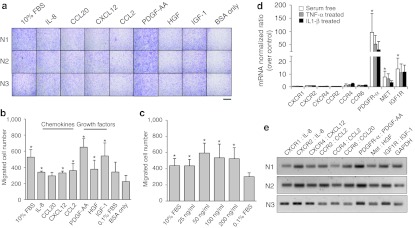
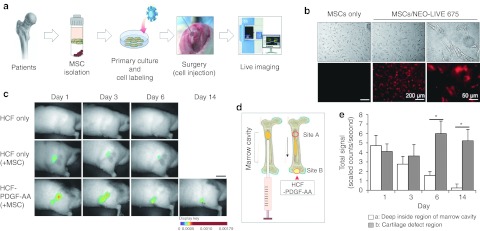
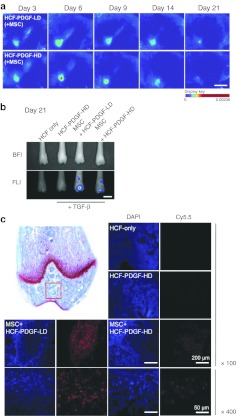
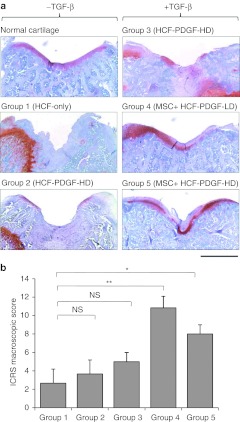
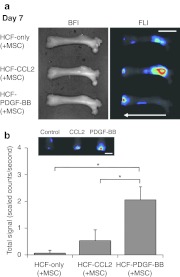
We devised and tested an in vivo system to monitor the migration of mesenchymal stem cells (MSCs) within the marrow cavity. In vitro studies confirmed that platelet-derived growth factor (PDGF)-AA had the most potent chemotactic effect of the tested factors, and possessed the greatest number of receptors in MSCs. MSCs were labeled with fluorescent nanoparticles and injected into the marrow cavity of nude rats through osteochondral defects created in the distal femur. The defects were sealed with HCF (heparin-conjugated fibrin) or PDGF-AA-loaded HCF. In the HCF-only group, the nanoparticle-labeled MSCs dispersed outside the marrow cavity within 3 days after injection. In the PDGF-AA-loaded HCF group, the labeled cells moved time-dependently for 14 days toward the osteochondral defect. HCF-PDGF in low dose (LD; 8.5 ng/µl) was more effective than HCF-PDGF in high dose (HD; 17 ng/µl) in recruiting the MSCs to the osteochondral defect. After 21 days, the defects treated with PDGF and transforming growth factor (TGF)-β1-loaded HCF showed excellent cartilage repair compared with other groups. Further studies confirmed that this in vivo osteochondral MSCs tracking system (IOMTS) worked for other chemoattractants (chemokine (C-C motif) ligand 2 (CCL2) and PDGF-BB). IOMTS can provide a useful tool to examine the effect of growth factors or chemokines on endogenous cartilage repair.


Figures

Figure 1
Figure 1
Comparison of the chemotactic activity of chemokines and growth factors in human MSCs. (a) Migrated cells stained with hematoxylin and eosin. Bar = 400 µm. (b) The number of migrated cells. (c) The dose effect of PDGF-AA on MSCs migration. The bars represent the mean ± SD of migrated cells. n = 3, *P < 0.05 to the negative control. (d) Real-time PCR analysis of receptors. The bars represent the mean ± SD of normalized ratio over the control. n = 3, *P < 0.05 to CXCR2. (e) Gel electrophoresis of the RT-PCR products of each receptor. BSA, bovine serum albumin; CCL2, chemokine (C-C motif) ligand 2; CXCL12, chemokine (C-X-C motif) ligand 12; FBS, fetal bovine serum; GAPDH, glyceraldehyde-3-phosphate dehydrogenase; HGF, hepatocyte growth factor; IGF, insulin-like growth factor; IL, interleukin; mRNA, messenger RNA; MSC, mesenchymal stem cell; PDGF, platelet-derived growth factor; RT-PCR, reverse transcription-PCR; TNF-α, tumor necrosis factor-α.
Figure 2
Figure 2
In vivo monitoring of fluorescent nanoparticle-labeled human MSCs in athymic nude rats. (a) The general schema of in vivo experiments. (b) Human MSCs labeled with a fluorescent silica nanoparticle. The left panels are the bright-field images, and the right panels are Cy5.5 fluorescence images. (c) In vivo monitoring of nanoparticle-labeled MSCs. Bar = 20 mm. (d) Two specific sites of signal measurements. Site A represents the most proximal portion of the marrow cavity. Site B represents the osteochondral defect area releasing PDGF-AA. (e) Quantification of the MSCs migration effect by PDGF-AA release from the osteochondral defect in PDGF-AA-loaded HCF group. The bars represent the mean ± SD of fluorescent signal intensity. n = 3, *P < 0.05. HCF, heparin-conjugated fibrin; MSC, mesenchymal stem cell; PDGF, platelet-derived growth factor.
Figure 3
Figure 3
In vivo MSCs tracking patterns depending on PDGF-AA concentration in osteochondral defect regions. (a) In vivo monitoring of fluorescent nanoparticle-labeled human MSCs depending on the PDGF-AA concentration in rats. Bar = 20 mm. (b) Quantitative ROI analysis using the removed femurs. BFI and FLI represent bright-field image and fluorescent image, respectively. Bar = 5 mm. (c) CLSM images of femur paraffin sections after DAPI staining. The red square of the upper-left panel indicates common detection regions within each femur section. CLSM, confocal laser scanning microscopy; DAPI, 4′,6-diamidino-2-phenylindole; HCF, heparin-conjugated fibrin; HD, high dose; LD, low dose; MSC, mesenchymal stem cell; PDGF, platelet-derived growth factor; ROI, region of interest; TGF-β, transforming growth factor-β.
Figure 4
Figure 4
Effect of the migrated human MSCs on the healing of an osteochondral defect. (a) Histological findings of the defect from Safranin-O staining. Bar = 1 mm. (b) ICRS macroscopic score of each group. Bars represent the mean ± SD of the score. n = 3, *P < 0.05, **P < 0.01, NS = not significant. HCF, heparin-conjugated fibrin; HD, high dose; ICRS, International Cartilage Repair Society; LD, low dose; MSC, mesenchymal stem cell; PDGF, platelet-derived growth factor; TGF-β, transforming growth factor-β
Figure 5
Figure 5
The effects of chemokine CCL2 and growth factor PDGF-BB treated in an osteochondral defect on the migration of MSC. (a) Fluorescence image of migrated MSCs in the removed femurs at 7 days post-cell injection. BFI and FLI represent bright-field image and fluorescent image, respectively. White arrow represents the migratory direction of labeled MSCs. Bar = 10 mm. (b) The total fluorescent intensity of a defect region in the removed femur. Bar = 5 mm. Bar graphs represents the mean ± SD of fluorescent signal intensity. n = 3, *P < 0.05. CCL2, chemokine (C-C motif) ligand 2; HCF, heparin-conjugated fibrin; MSC, mesenchymal stem cell; PDGF, platelet-derived growth factor.

Similar articles

Cited by

References

    1. Alhadlaq A., and, Mao JJ. Tissue-engineered neogenesis of human-shaped mandibular condyle from rat mesenchymal stem cells. J Dent Res. 2003;82:951–956. - PubMed
    1. Rahfoth B, Weisser J, Sternkopf F, Aigner T, von der Mark K., and, Bräuer R. Transplantation of allograft chondrocytes embedded in agarose gel into cartilage defects of rabbits. Osteoarthr Cartil. 1998;6:50–65. - PubMed
    1. Steinert A, Weber M, Dimmler A, Julius C, Schütze N, Nöth U.et al. (2003Chondrogenic differentiation of mesenchymal progenitor cells encapsulated in ultrahigh-viscosity alginate J Orthop Res 211090–1097. - PubMed
    1. Li WJ, Tuli R, Okafor C, Derfoul A, Danielson KG, Hall DJ.et al. (2005A three-dimensional nanofibrous scaffold for cartilage tissue engineering using human mesenchymal stem cells Biomaterials 26599–609. - PubMed
    1. Benya PD, Padilla SR., and, Nimni ME. Independent regulation of collagen types by chondrocytes during the loss of differentiated function in culture. Cell. 1978;15:1313–1321. - PubMed

Publication types