. 2012 Apr 10:3:774.
doi: 10.1038/ncomms1783.

Staged decline of neuronal function in vivo in an animal model of Alzheimer's disease

Affiliations
Free PMC article

Staged decline of neuronal function in vivo in an animal model of Alzheimer's disease

Christine Grienberger et al. Nat Commun. .
Free PMC article

Abstract

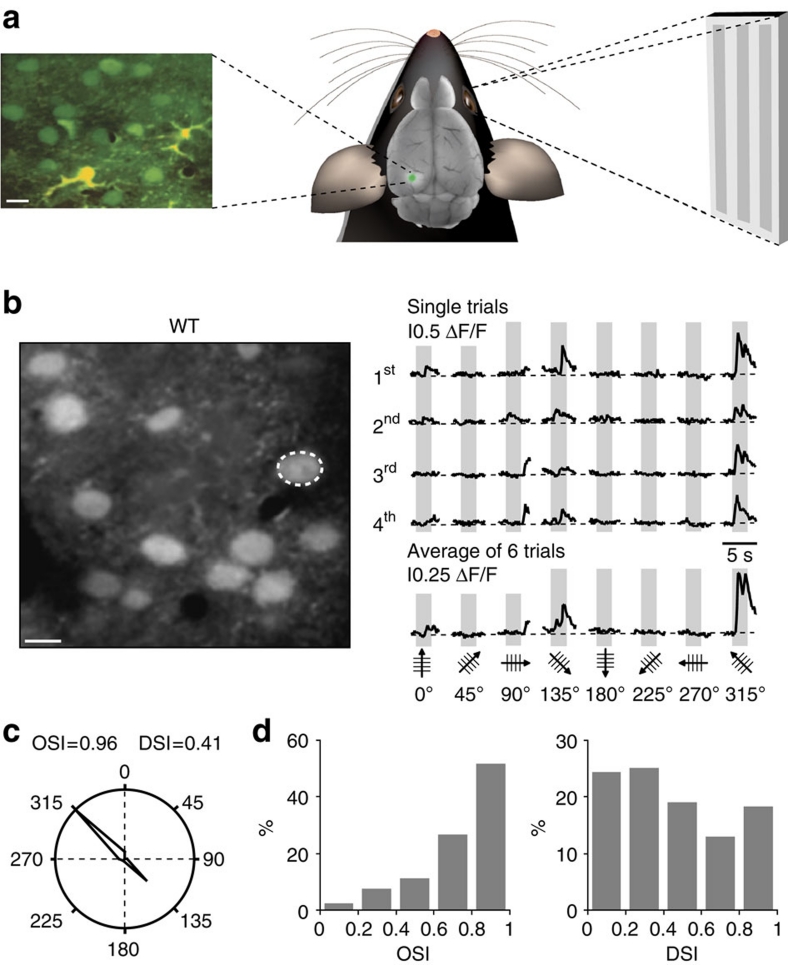
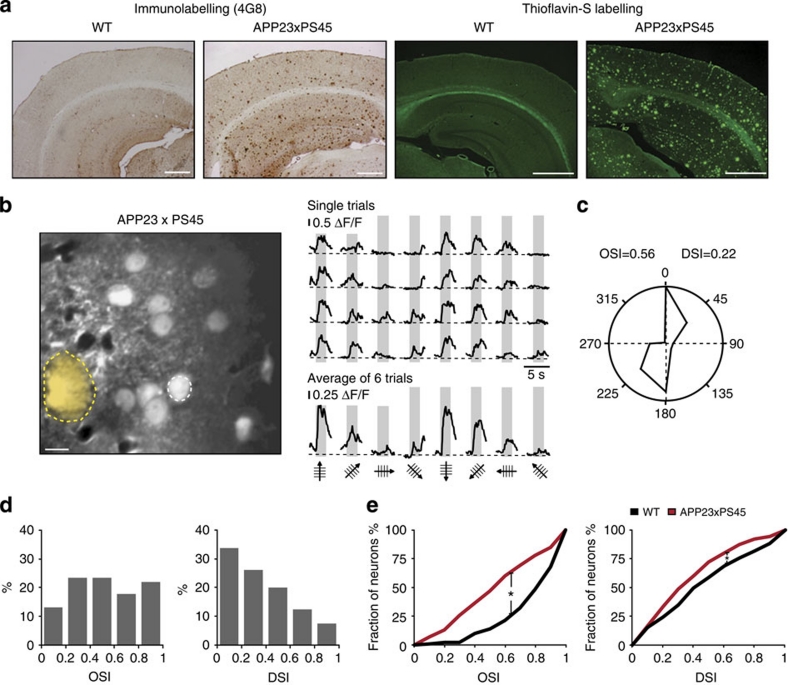
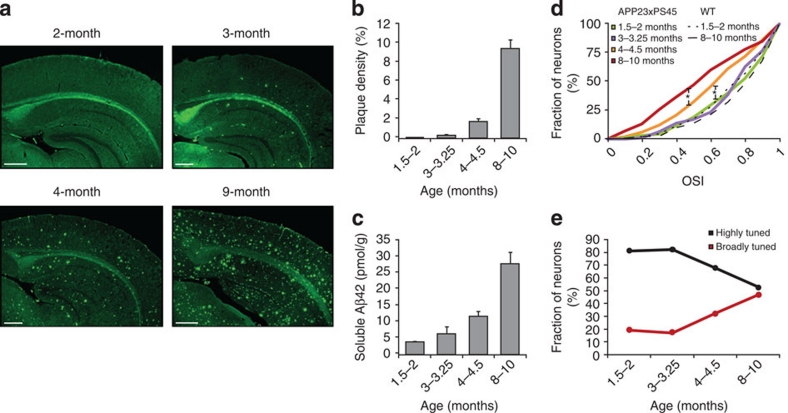
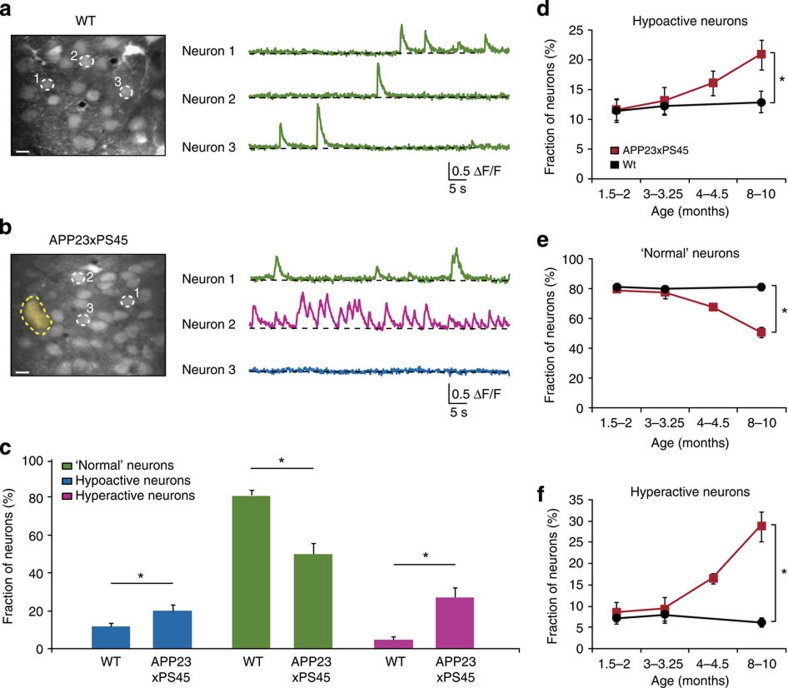
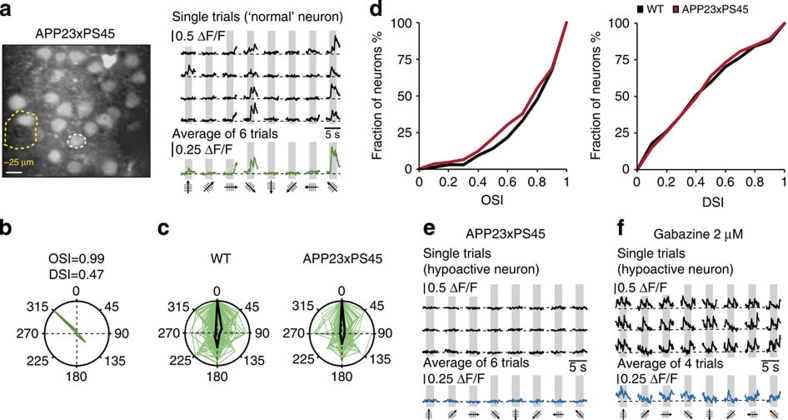
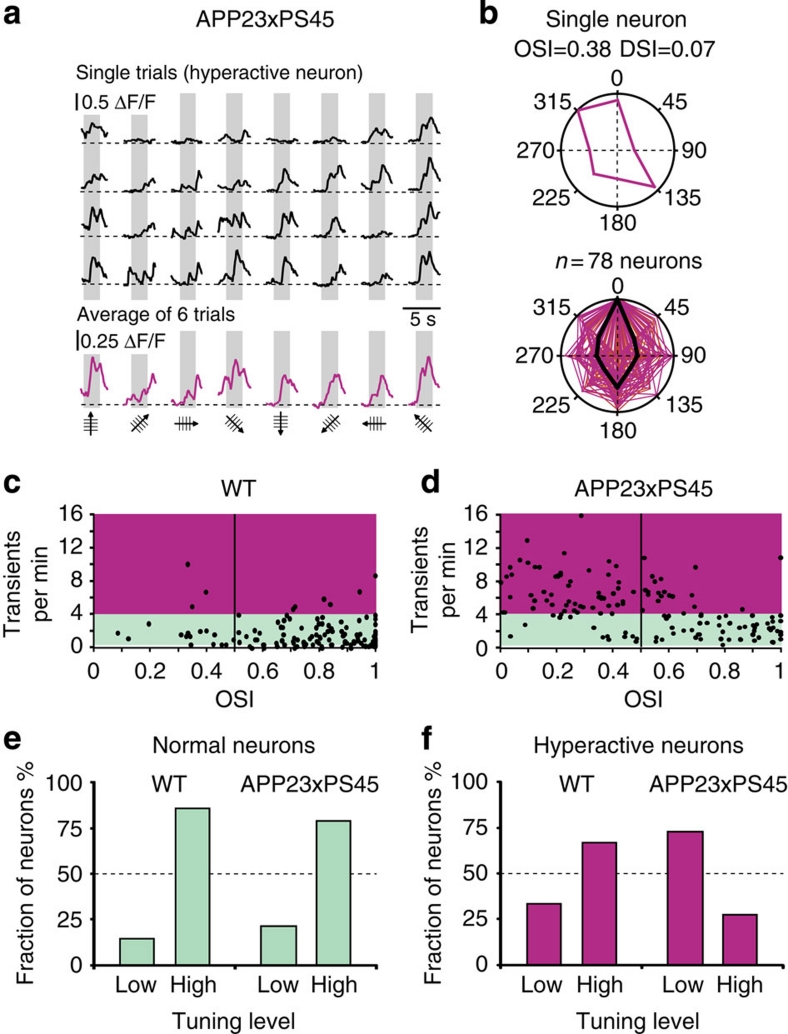
The accumulation of amyloid-β in the brain is an essential feature of Alzheimer's disease. However, the impact of amyloid-β-accumulation on neuronal dysfunction on the single cell level in vivo is poorly understood. Here we investigate the progression of amyloid-β load in relation to neuronal dysfunction in the visual system of the APP23×PS45 mouse model of Alzheimer's disease. Using in vivo two-photon calcium imaging in the visual cortex, we demonstrate that a progressive deterioration of neuronal tuning for the orientation of visual stimuli occurs in parallel with the age-dependent increase of the amyloid-β load. Importantly, we find this deterioration only in neurons that are hyperactive during spontaneous activity. This impairment of visual cortical circuit function also correlates with pronounced deficits in visual-pattern discrimination. Together, our results identify distinct stages of decline in sensory cortical performance in vivo as a function of the increased amyloid-β-load.


Figures

Figure 1
Figure 1. Orientation and direction tuning of visual cortex neurons in 8–10 month-old WT mice.
(a) Experimental arrangement for in vivo two-photon calcium imaging of stimulation-evoked neuronal activity. Left panel, in vivo two-photon image of cortical layer 2/3 of the primary visual cortex stained in vivo with the fluorescent calcium indicator dye Oregon Green BAPTA-1 (green) and the glial marker Sulforhodamine 101 (yellow). Right panel, visual stimuli (drifting gratings) were projected on a screen placed 30 cm away from the contralateral eye of the mouse. (b) Left panel, in vivo two-photon image of layer 2/3 neurons in the visual cortex of a WT mouse (8-months). Right panel, stimulus-evoked calcium transients recorded from the orientation selective neuron indicated in the left panel by a white dotted circle. Grey regions indicate periods of visual stimulation with drifting gratings schematized by oriented arrows on the bottom of each panel. Four single trials are represented on top and the average of six trials is shown below. Scale bar, 10 μm. (c) Polar plot showing the neuron's response function to oriented drifting gratings. The responses to each of the eight directions tested were normalized with respect to the maximal response. Then, the function was constructed by connecting the eight values. (d) Distribution of the orientation (OSI) and direction (DSI) selectivity indices of all responsive neurons (n=131 neurons) recorded in the visual cortices of 13 WT mice.
Figure 2
Figure 2. Impaired orientation/direction tuning of visual cortex neurons in 8–10-month-old APP23×PS45 mice.
(a) Amyloid-β-deposition in APP23×PS45 mice. Micrographs of coronal brain slices of visual cortices stained with the 4G8 antibody (a) and Thioflavin-S (b). The slices were obtained from a wild-type (WT, left panels) and an APP23×PS45 mouse (right panels) of the same age (9-months). Scale bars, 500 μm. (b) Left panel, in vivo two-photon image of layer 2/3 neurons in the visual cortex of an APP23×PS45 mouse (8-months). The broken yellow line delineates a Thioflavin-S-positive plaque observed in the imaged focal plane. Right panel, stimulus-evoked calcium transients recorded from the neuron indicated by a white-dotted circle in the left panel. Grey regions indicate periods of visual stimulation with drifting gratings schematized by oriented arrows on the bottom of each panel. Single trials are represented on top and, the average of six trials is shown below. Scale bar, 10 μm. (c) Polar plot showing the neuron's response function to oriented drifting gratings. The responses to each of the eight directions tested were normalized with respect to the maximal response. Then, the function was constructed by connecting the eight values. (d) Distribution of the orientation (OSI) and direction (DSI) selectivity indices of all responsive neurons (n=145 neurons) recorded in the visual cortices of 15 APP23×PS45 mice. (e) Cumulative distributions of the orientation (OSI) and direction (DSI) selectivity indices determined for all responsive neurons recorded in WT (black) and APP23×PS45 (red) mice. Overall the visual cortex neurons of APP23×PS45 mice have significantly lower orientation and direction selectivities compared with WT ones (Mann–Whitney test, OSI, *P<0.001; DSI, *P<0.05).
Figure 3
Figure 3. Age dependence of amyloid-β-load and orientation tuning in the visual cortex of APP23×PS45 mice.
(a) Amyloid-β-deposition in the visual cortex of APP23×PS45 mice. Micrographs of coronal brain slices of visual cortices stained with Thioflavin-S. The slices were obtained from 2-, 3-, 4- and 9-month-old APP23×PS45 mice. Scale bars, 500 μm. (b) Plaque density in the visual cortex of APP23×PS45 mice, determined in the four different age groups (1.5–2-, 3–3.25-, 4–4.5- and 8–10-month-old, n=5, 4, 5 and 6 mice, respectively). (c) Concentration of soluble Aβ42 in the forebrain of APP23×PS45 mice (n=5, 5, 6 and 5 mice, respectively). (d) Cumulative distributions of the OSIs determined for all responsive neurons recorded in APP23×PS45 mice at the different age groups (n=95, 94, 149 and 145 neurons in 7, 6, 8 and 15 mice, respectively) as well as in 1.5–2-month-old and 8–10-month-old WT mice (n=132 and 131 neurons in 7 and 13 mice, respectively). Functional impairments were observed only from the age of 4–4.5-months (Mann–Whitney test, APP23×PS45, 2-4-months, *P<0.005; 4–8-months, *P<0.005). (e) Proportion of highly (OSI>0.5) and broadly (OSI<0.5) tuned neurons in the visual cortex of APP23×PS45 mice (same neurons as in d).
Figure 4
Figure 4. Age-dependence of spontaneous activity in the visual cortex of WT and APP23×PS45 mice.
(a,b) Spontaneous calcium transients recorded in vivo from layer 2/3 neurons of the visual cortex of a WT (a) and an APP23×PS45 (b) mouse (10- and 9-months, respectively). Left panels, in vivo two-photon images (z-stack, 0.5 μm step,±20 μm from the imaged focal plane). The broken yellow line delineates a Thioflavin-S positive plaque. Right panels, spontaneous calcium transients colour-coded according to the activity frequency: green for 'normal' neurons (0.25–4 transients per min), purple for hyperactive neurons (>4 transients per min) and blue for hypoactive neurons (0–0.25 transients per minute). Scale bar, 10 μm. (c) Bar graph showing the relative proportion of hypoactive, 'normal' and hyperactive neurons in 8–10-month-old WT and APP23×PS45 mice (n=630 and 806 neurons in 15 and 19 mice, respectively). Error bars indicate s.e.m. (Mann–Whitney test, hypoactive *P<0.05, 'normal' *P<0.001 and hyperactive neurons *P<0.001). (d–f) Proportion of hypoactive, 'normal' and hyperactive neurons in WT (black; n=686, 411, 630 neurons in 9, 5 and 15 mice, respectively) and APP23×PS45 (red; n=634, 620, 750 and 806 neurons in 10, 9, 10 and 19 APP23×PS45 mice, respectively) mice at four different age groups (1.5–2, 3–3.25, 4–4.5 and 8–10 months). Error bars indicate s.e.m. (Mann–Whitney test, hypoactive *P<0.05, 'normal' *P<0.001 and hyperactive neurons *P<0.001).
Figure 5
Figure 5. Response of normal and hypoactive neurons to stimulus orientation and direction.
(a) Left panel, in vivo two-photon image of layer 2/3 neurons in the visual cortex of an APP23×PS45 mouse (8-months). The broken yellow line delineates a Thioflavin-S-positive plaque that was located 25 μm below the imaged focal plane (seen on the z-stack). Right panel, calcium transients evoked by visual stimulation in the 'normal' neuron indicated in the left panel by a white-dotted circle. Scale bar, 10 μm. (b) Polar plot showing the neuron's response function to oriented drifting gratings. The responses to each of the eight directions tested were normalized with respect to the maximal response. Then, the function was constructed by connecting the eight values. (c) Overlap of the polar plots obtained for all responsive 'normal' neurons recorded in 13 WT (n=107 neurons) and 15 APP23×PS45 (n=67 neurons) mice. Polar plots were normalized to a preferred direction of 0° and maximal response. Black lines indicate median tuning function. (d) Cumulative distributions of the orientation (OSI) and direction (DSI) selectivity indices determined for all 'normal' neurons recorded in 13 WT (black) and 15 APP23×PS45 (red) mice. 'Normal' neurons were similarly tuned for orientation and direction in both APP23×PS45 and WT mice (Mann–Whitney test, OSI, P=0.39; DSI, P=0.92). (e) Calcium imaging of a hypoactive neuron's activity recorded during visual stimulation in the layer 2/3 of an APP23×PS45 mouse (8.5-months). Four single trials are represented with black lines and the average of six trials is shown in blue. (f) Calcium transients recorded from the same neuron as in panel e after application of gabazine.
Figure 6
Figure 6. Response of hyperactive neurons to stimulus orientation and direction.
(a) Stimulus-evoked calcium transients recorded from a hyperactive neuron in an APP23×PS45 mouse (8-months). (b) Top panel, polar plot showing the response function (purple lines) to oriented drifting gratings of the same neuron as in panel a. Lower panel, overlap of the polar plots obtained for all responsive hyperactive neurons recorded in 15 APP23×PS45 mice (n=78 neurons). Polar plots were normalized to a preferred direction of 0° and maximal response. Black lines indicate median tuning function. (c,d) Scatter plots showing the relation between the OSI and the frequency of spontaneous calcium transients in WT (c) and APP23×PS45 (d) mice (n=131 and 145 neurons from 13 and 15 mice, respectively). The coloured areas indicate the frequency domains of 'normal' (green) and hyperactive (purple) spontaneous activity. (e,f) Comparison of the fractions of 'normal' (e) and hyperactive (f) neurons with low (OSI<0.5) and high orientation tuning (OSI>0.5) levels in WT and APP23×PS45 mice (same neurons as in c,d).

References

    1. Blennow K., de Leon M. J. & Zetterberg H. Alzheimer's disease. Lancet 368, 387–403 (2006). - PubMed
    1. Nestor P. J., Scheltens P. & Hodges J. R. Advances in the early detection of Alzheimer's disease. Nat. Med. 10(Suppl), S34–S41 (2004). - PubMed
    1. Djordjevic J., Jones-Gotman M., De Sousa K. & Chertkow H. Olfaction in patients with mild cognitive impairment and Alzheimer's disease. Neurobiol. Aging 29, 693–706 (2008). - PubMed
    1. Mesholam R. I., Moberg P. J., Mahr R. N. & Doty R. L. Olfaction in neurodegenerative disease: a meta-analysis of olfactory functioning in Alzheimer's and Parkinson's diseases. Arch. Neurol. 55, 84–90 (1998). - PubMed
    1. Devanand D. P. et al.. Olfactory deficits in patients with mild cognitive impairment predict Alzheimer's disease at follow-up. Am. J. Psychiatry 157, 1399–1405 (2000). - PubMed

Publication types

Substances