. 2012 Apr 10;106(8):1406-14.
doi: 10.1038/bjc.2012.103.

Cross-suppression of EGFR ligands amphiregulin and epiregulin and de-repression of FGFR3 signalling contribute to cetuximab resistance in wild-type KRAS tumour cells

Affiliations

Cross-suppression of EGFR ligands amphiregulin and epiregulin and de-repression of FGFR3 signalling contribute to cetuximab resistance in wild-type KRAS tumour cells

C Oliveras-Ferraros et al. Br J Cancer. .

Abstract

Background: In addition to the mutational status of KRAS, the epidermal growth factor receptor (EGFR) ligands amphiregulin (AREG) and epiregulin (EREG) might function as bona fide biomarkers of cetuximab (Ctx) sensitivity for most EGFR-driven carcinomas.

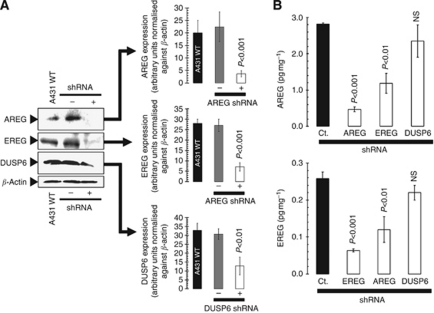
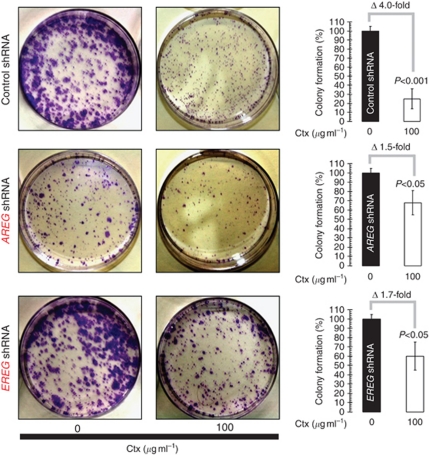
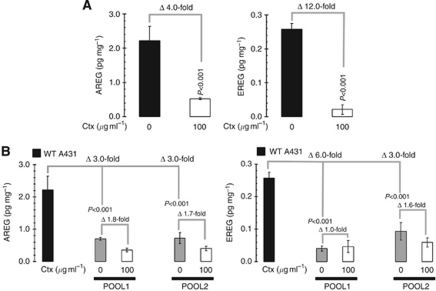
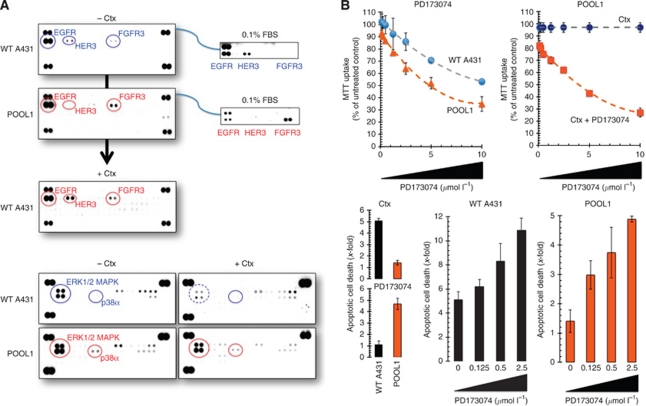
Methods: Lentivirus-delivered small hairpin RNAs were employed to specifically reduce AREG or EREG gene expression in wild-type KRAS A431 squamous cell carcinoma cells. Colony-forming assays were used to monitor the impact of AREG and EREG knockdown on Ctx efficacy. Amphiregulin and EREG protein expression levels were assessed by quantitative ELISA in parental A431 cells and in pooled populations of A431 cells adapted to grow in the presence of Ctx. A phosphoproteomic platform was used to measure the relative level of phosphorylation of 42 distinct receptor tyrosine kinases before and after the acquisition of resistance to Ctx.

Results: Stable gene silencing of either ligand was found to notably reduce the expression of the other ligand. Parental A431 cells with normal expression levels of AREG/EREG exhibited significantly increased growth inhibition in response to Ctx, compared with derivatives that are engineered to produce minimal AREG/EREG. The parental A431 cells acutely treated with Ctx exhibited reduced basal expression levels of AREG/EREG. Pooled populations of Ctx-resistant A431 cells expressed significantly lower levels of AREG/EREG and were insensitive to the downregulatory effects of Ctx. Phosphoproteomic screen identified a remarkable hyperactivation of FGFR3 in Ctx-resistant A431 cells, which gained sensitivity to the cytotoxic and apoptotic effects of the FGFR3 TK inhibitor PD173074. The A431 parental cells acutely treated with Ctx rapidly activated FGFR3 and their concomitant exposure to Ctx and PD173074 resulted in synergistic apoptosis.

Conclusion: Cross-suppression of AREG/EREG expression may explain the tight co-expression of AREG and EREG, as well as their tendency to be more highly expressed than other EGFR ligands to determine Ctx efficacy. The positive selection for Ctx-resistant tumour cells exhibiting AREG/EREG cross-suppression may have an important role in the emergence of Ctx resistance. As de-repression of FGFR3 activity rapidly replaces the loss of EGFR-ligand signalling in terms of cell proliferation and survival, combinations of Ctx and FGFR3-targeted drugs may be a valuable strategy to enhance the efficacy of single Ctx while preventing or delaying acquired resistance to Ctx.


Conflict of interest statement

Cristina Oliveras-Ferraros received a research salary from a Grant Award by the ‘Fundacion Salud 2000’, which is promoted by Merck Serono (Madrid, Spain). All other authors declare no conflict of interest.

Figures

Figure 1
Figure 1
Cross-regulation of EGFR ligands AREG and EREG in A431 SCC cells. (A) Lysates from A431 parental cells and their derivatives ‘control shRNA’, ‘AREG shRNA’, ‘EREG shRNA’, and ‘DUSP6-shRNA’ were prepared and analysed by western blot for expression of AREG, EREG, and DUSP6 proteins using specific antibodies as described in the ‘Materials and Methods’ section. The Western blots were also probed with an anti-β-actin antibody to demonstrate equal protein loading. (B) Commercially available ELISAs were used for the quantitative determination of AREG and EREG protein expression in whole-cell lysates from A431-derived ‘control (Ct.) shRNA’, ‘AREG shRNA’, ‘EREG shRNA’, and ‘DUSP6-shRNA’ cell lines. Results are means (columns) and 95% confidence intervals (bars) of two independent experiments made in duplicate. Statistically significant differences (one-factor ANOVA analysis) between experimental condition groups (i.e., A431 cells stably expressing shRNAs against AREG, EREG, and DUSP6) and ‘control (Ct.) shRNA’ cells are shown (NS no statistically significant).
Figure 2
Figure 2
Impact of. AREG, EREG, or DUSP6 gene silencing on Ctx-regulated SCC cell proliferation and survival in anchorage-dependent conditions. The left side figure shows representative microphotographs of colonies formed on the plates of control (untreated) and Ctx-treated ‘control (Ct.) shRNA’, ‘AREG shRNA’, or ‘EREG shRNA’ cell cultures, as specified. The right side bar graphs show the number of colonies formed after treatment with Ctx compared with the control (untreated) ‘control (Ct.) shRNA’, ‘AREG shRNA’, or ‘EREG shRNA’ cell cultures, as specified. The error bar indices the 95% confidence intervals for each mean (columns) generated from triplicate experiments. Statistically significant differences (one-factor ANOVA analysis) between experimental condition groups (i.e., Ctx-treated) and control (i.e., Ctx-untreated) groups are shown.
Figure 3
Figure 3
Differential regulation of EGFR ligands AREG and EREG by Ctx in Ctx-responsive and Ctx-resistant SCC cells. AREG- and EREG-specific ELISAs were used to quantitatively assess the effects of Ctx treatment (48 h) in Ctx-responsive A431 parental cells (A) and in two independent Ctx-resistant A431 pooled populations (B). Results are means (columns) and 95% confidence intervals (bars) of two independent experiments made in duplicate. Statistically significant differences (one-factor ANOVA analysis) between Ctx-untreated and Ctx-treated cells and/or between A431 parental cells and their Ctx-unresponsive pooled populations are shown.
Figure 4
Figure 4
Activation of FGFR3 replaces loss of EGFR-ligands signalling and contributes to Ctx resistance through pathway redundancy. (A) Phosphoproteome profiling of A431 cells during acquisition of resistance to Ctx. Total cell lysates (750 μg) from A431 cells before (WT) and after (POOL1) adaptation to Ctx treatment were incubated with membranes of the phosphoproteomic platforms human Phospho-RTK (top panels; 42 different RTKs) and human Phospho-MAPK (bottom panels; 23 different MAPKs and other serine/threonine kinases) as per the manufacturer’s instructions (Proteome Profiler; R&D Systems). Figure shows representative phosphoproteome analyses that were developed on X-ray film following exposure to chemiluminescent reagents. Equivalent results were obtained in three independent experiments. (B) Synergy analyses of the interaction between Ctx and PD173074. Top: Ctx-naive A431 parental cells and Ctx-resistant POOL1 cells were incubated with graded concentrations of PD173074 in the absence or presence of 100 μg ml−1 Ctx, as specified. Cell viability, measured using MTT uptake assays, was expressed as % of untreated control cells (=100% cell viability). Results are means and 95% confidence intervals (bars) of three independent experiments made in triplicate. Bottom: Quantification of apoptosis-related cell death in Ctx-naive A431 parental cells and Ctx-resistant POOL1 cells in response to 72 h treatment with Ctx, PD173074 or Ctx plus PD173074, as specified, was determined by Cell Death ELISA as described in ‘Materials and Methods’. Data are the mean (columns) and 95% confidence intervals (bars) of three independent experiments performed in duplicates.

References

    1. Agus DB, Akita RW, Fox WD, Lewis GD, Higgins B, Pisacane PI, Lofgren JA, Tindell C, Evans DP, Maiese K, Scher HI, Sliwkowski MX (2002) Targeting ligand-activated ErbB2 signaling inhibits breast and prostate tumor growth. Cancer Cell 2: 127–137 - PubMed
    1. Baker JB, Dutta D, Watson D, Maddala T, Munneke BM, Shak S, Rowinsky EK, Xu LA, Harbison CT, Clark EA, Mauro DJ, Khambata-Ford S (2011) Tumour gene expression predicts response to cetuximab in patients with KRAS wild-type metastatic colorectal cancer. Br J Cancer 104: 488–495 - PMC - PubMed
    1. Baker JB, Dutta D, Watson D, Maddala T, Shak S, Rowinsky EK, Xu L, Clark E, Mauro DJ, Khambata-Ford S (2008) Evaluation of tumor gene expression and K-Ras mutations in FFPE tumor tissue as predictors of response to cetuximab in metastatic colorectal cancer. J Clin Oncol 27Suppl3512 (abstract)
    1. De Roock W, Jansenss M, Biesmans B, Jacobs J, De Schutter J, Fieuws E, Van Cutsem E, Tejpar S (2009) DUSPs as marker of MEK/Erk activation in primary colorectal cancer. J Clin Oncol 27: 15s (abstract 4064)
    1. Engelman JA, Janne PA (2008) Mechanisms of acquired resistance to epidermal growth factor receptor tyrosine kinase inhibitors in non-small cell lung cancer. Clin Cancer Res 14: 2895–2899 - PubMed

Publication types

MeSH terms