. 2012 Jun;86(12):6491-502.
doi: 10.1128/JVI.00496-12. Epub 2012 Apr 4.

Role for TBC1D20 and Rab1 in hepatitis C virus replication via interaction with lipid droplet-bound nonstructural protein 5A

Affiliations

Role for TBC1D20 and Rab1 in hepatitis C virus replication via interaction with lipid droplet-bound nonstructural protein 5A

Inbar Nevo-Yassaf et al. J Virol. 2012 Jun.

Abstract

Replication and assembly of hepatitis C virus (HCV) depend on the host's secretory and lipid-biosynthetic machinery. Viral replication occurs on endoplasmic reticulum (ER)-derived modified membranes, while viral assembly is thought to occur on lipid droplets (LDs). A physical association and coordination between the viral replication and assembly complexes are prerequisites for efficient viral production. Nonstructural protein 5A (NS5A), which localizes both to the ER and LDs, is an ideal candidate for this function. Here, the interaction of NS5A with host cell membranes and binding partners was characterized in living cells. The binding of NS5A to LDs is apparently irreversible, both in HCV-infected cells and when ectopically expressed. In HCV-infected cells, NS5A fluorescence was observed around the LDs and in perinuclear structures that were incorporated into a highly immobile platform superimposed over the ER membrane. Moreover, TBC1D20 and its cognate GTPase Rab1 are recruited by NS5A to LDs. The NS5A-TBC1D20 interaction was shown to be essential for the viral life cycle. In cells, expression of the Rab1 dominant negative (Rab1DN) GTPase mutant abolished steady-state LDs. In infected cells, Rab1DN induced the elimination of NS5A from viral replication sites. Our results demonstrate the significance of the localization of NS5A to LDs and support a model whereby its interaction with TBC1D20 and Rab1 affects lipid droplet metabolism to promote the viral life cycle.


Figures
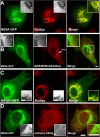
Fig 1
Fig 1
Intracellular localization of NS5A expressed in living cells. (A) Colabeling of NS5A-GFP with the LD core marker Bodipy. Huh7 cells were transfected with NS5A-GFP (green); at 24 h posttransfection, the cells were labeled for 20 min with 20 μg/ml Bodipy (red). (Insets) A cluster of LDs. (B) Comparison of the intracellular localization of NS5A-GFP (green) with the host Golgi-binding peripheral protein GRASP65-DiHcRed (red) cotransfected into Huh7 cells. (Insets) Enlarged LDs. Bar = 5 μm. (C) Colabeling of NS5A from genotype 2a (NS5A-GFP2a) with the LD marker Bodipy. Huh7 cells were transfected with NS5A-GFP2a (green); at 24 h posttransfection, the cells were labeled for 20 min with 20 μg/ml Bodipy (red). (Insets) Enlarged LDs. Bar = 5 μm. (D) Intracellular localization of NS5A in OA-treated COS7 cells. COS7 cells were cotransfected with NS5A-GFP (green) and the ER membrane marker VSVGAIA-mCherry (red) that lacks the ER export motif. Cells were pretreated with 400 μM OA complexed to BSA for 4 h. (Insets) A cluster of LDs. Bar = 5 μm.
Fig 2
Fig 2
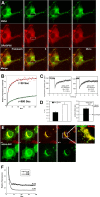
Analysis of the binding dynamics of NS5A-GFP to ER and LD membranes. (A) Dual FRAP analysis of NS5A-GFP (green) and GRASP65-DiHcRed (red) in Huh7 cells. A rectangle over an area containing a cluster of LDs in a cell coexpressing NS5A-GFP and DiHcRed-GRASP65 was photobleached using high-power Ar 488-nm and He Ne 543-nm lasers. Images were captured for approximately 4 min. (B) Quantitative analysis of the experiment whose results are shown in panel A. The average fluorescence intensity of NS5A-GFP (green filled circles) and DiHcRed-GRASP65 (red filled circles) in the bleach box is plotted against time and fitted to the equation described in Materials and Methods. τ values are the inverse of the k of the exponential. R2 values were 0.92 and 0.99 for NS5A-GFP and GRASP65, respectively. (C) FRAP beam-size analysis of ER membrane-associated NS5A-GFP. Typical FRAP curves of NS5A-GFP using ×63 and ×40 objectives at 37°C. Solid lines, best fit of a nonlinear regression analysis (Materials and Methods). Note the different time scales between the two objectives. (D) FRAP beam-size analysis. Bars are the mean ± standard error of the mean of 35 to 45 measurements. The τ values (left) and ratios (right) are shown. (E) Comparison between the ER and LD binding of NS5A using saponin treatment. COS7 cells expressing NS5A-GFP (green and bottom) were labeled with Bodipy (red) after 4 h of OA treatment. Saponin was added to a final concentration of 0.2%, and images were captured for several minutes. (Inset) Magnified NS5A-GFP-decorated LDs. (F) Quantitative analysis of the experiment described in panel E. The changes in relative residual fluorescence intensity of NS5A-GFP in two regions of interest over LDs and the ER are plotted against time upon addition of the detergent. Data were fitted to an exponential-decay equation. The results shown are typical results from three independent experiments.
Fig 3
Fig 3
Targeting of NS5A-GFP to LDs. (A) Time-lapse analysis of OA-induced NS5A-decorated LDs. COS7 cells were transfected with NS5A-GFP. At 24 h posttransfection, cells were treated with 400 μM OA-BSA complex and images were captured at 30-s intervals for 2.8 h. Shown is a brightest-pixel projection of the entire sequence. The enlarged inverted inset shows the transport-coupled maturation of LDs. The red arrowhead points to the LD at an early time point. The yellow arrowhead points to a mature LD at a late time point. (B) Bodipy labeling during NS5A-decorated LD biogenesis. Cells expressing NS5A-GFP were treated with 400 μM OA after labeling with Bodipy. An image of the entire cell on the left-end side was captured at 71 min after OA addition. Bar = 10 μm. The area marked by the white rectangle is enlarged in the panels on the right. Included are two time points in the time-lapse movie in Movie S2 in the supplemental material. Bar = 5 μm. (C) Localization of NS5A-GFP to OA-induced, Bodipy-labeled LDs. Huh7 cells were transfected with NS5A-GFP (green). At 24 h posttransfection, cells were incubated with 400 μM OA-BSA complex for 4 h and labeled for 20 min with 20 μg/ml Bodipy (red). Insets are magnified (3×), and inverted separate channels of Bodipy and GFP are shown. Top left and bottom right insets show NS5A-labeled strictures at the perinuclear region and cell periphery, respectively. The brightness and contrast of the lower right inset were adjusted to compensate for the weak signal. Blue arrowheads indicate the area within the ER where Bodipy labeling coincides with increased NS5A-GFP labeling. Bar = 5 μm.
Fig 4
Fig 4
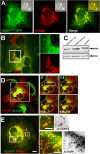
Intracellular distribution of NS5A in JC1/GFP-containing cells. (A) NS5A from genotype 2a containing a GFP inserted within domain III (green, NS5A2a/DIII-GFP) is localized to the ER and to Bodipy-labeled (red) LDs. (Insets) Colocalization of NS5A2a/DIII-GFP with NS5A from genotype 1b (NS5A1b-mCherry). (B) Colocalization of GFP-tagged NS5A and steady-state LDs in full-length JC1/GFP genome-containing cells. Cells were labeled with Bodipy (red) 48 h after electroporation of the JC1/GFP (green) in vitro-transcribed RNA. The inset over the perinuclear replication zone is enlarged to show the LDs assimilated into the replication zone. (C) Western blot analysis comparing expression levels of ectopic NS5A-GFP and NS5A expressed from the full-length JC1/GFP genome. NS5A-GFP (1 or 2 μg, as indicated) was transfected into Huh7 cells. At 48 h posttransfection, cells were lysed and analyzed by Western blotting using a primary anti-GFP antibody. JC1/GFP-expressing cells were lysed and analyzed as described in the Materials and Methods section. (D) FRAP of NS5A-GFP and mCherry-GRASP65 in full-length JC1/GFP genome-containing cells. Cells were electroporated with the JC1/GFP RNA and at 48 h posttransfection were transfected with mCherry-tagged GRASP65. After an additional 24 h, a rectangle shown in the image on the left-hand side was photobleached using high-power Ar 488-nm and He Ne 543-nm lasers and images were captured for approximately 200 s. (E) Colocalization of the GFP-tagged NS5A and OA-induced LDs in JC1/GFP cells. Cells containing the JC1/GFP (green and inverted images on the right-hand side) genome were treated with OA prior to labeling with Bodipy (red). (Inset I) Cell periphery containing potentially forming LDs; (inset II) perinuclear region NS5A-labeled LDs are incorporated into the replication zone. Bar = 5 μm.
Fig 5
Fig 5
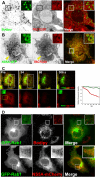
NS5A-GFP interacts with the host partners TBC1D20 and Rab1 at the ER-LD contact zone. (A) The intracellular localization of TBC1D20-GFP (center inverted image and red) in the absence of NS5A. LDs are labeled with Bodipy (green and inverted image on the left). Huh7 cells were transfected with TBC1D20-GFP (green and inverted image on the left) and labeled for 20 min with 20 μg/ml Bodipy. Images are confocal thin slices of living cells. Insets are magnified regions of interest containing LDs (black squares). (B) The intracellular localization of TBC1D20-GFP (center inverted image and red) in the presence of NS5A-GFP (green and inverted image on the left). Huh7 cells were cotransfected with NS5A-GFP (green and inverted image on the left) and TBC1D20-mCherry (red and inverted image in the center). Yellow arrowheads point to an area containing LDs enlarged in upper-right inset. Bar = 5 μm. (C) FLIP analysis to localize TBC1D20 to ER membranes. Huh7 cells were cotransfected with NS5A-GFP (green) and TBC1D20-mCherry (red). A rectangular region (white rectangle) over the ER was continuously photobleached with high laser power of Ar at 488 nm and He Ne at 543 nm. Fluorescence loss in the yellow rectangle was monitored. (Insets on bottom row) Prebleaching (left) and last image at the end of the experiment (right). The change in fluorescence intensity of NS5A-GFP (green line) and TBC1D20-mCherry (red line) within the yellow rectangle is plotted against time on the graph on the right. (D) NS5A recruits Rab1 to LDs. Huh7 cells were transfected with Rab1 (top) and labeled with Bodipy (red) or cotransfected with GFP-Rab1 and NS5A-mCherry (bottom). Images were captured at 24 h posttransfection. (Insets) Magnified LDs.
Fig 6
Fig 6
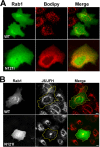
Rab1 activity is essential for LD biogenesis and HCV replication. (A) The dominant negative Rab1 N121I mutant blocks LD biogenesis. Huh7 cells were transfected with wild type (WT; top) or dominant negative (N121I; bottom) GFP-Rab1 (green). At 24 h posttransfection, images of living cells were captured after labeling for 20 min with 20 μg/ml Bodipy (red). (B) Huh7.5 cells were transfected with the J6/JFH genome by electroporation of 10 μg in vitro-transcribed J6/JFH RNA. After 24 h, the infected cells were transfected with wild-type (top) or dominant negative (N121I, bottom) GFP-Rab1 (green). At 24 h posttransfection, cells were fixed, permeabilized, and analyzed by immunofluorescence using anti-NS5A-specific antibody (middle and red). The contour of the Rab-GFP expressing cells is outlined in yellow. Bars = 10 μm.

Similar articles

Cited by

References

    1. Andre P, et al. 2002. Characterization of low- and very-low-density hepatitis C virus RNA-containing particles. J. Virol. 76:6919–6928 - PMC - PubMed
    1. Appel N, et al. 2008. Essential role of domain III of nonstructural protein 5A for hepatitis C virus infectious particle assembly. PLoS Pathog. 4:e1000035 doi:10.1371/journal.ppat.1000035 - DOI - PMC - PubMed
    1. Bartenschlager R, Penin F, Lohmann V, Andre P. 2011. Assembly of infectious hepatitis C virus particles. Trends Microbiol. 19:95–103 - PubMed
    1. Bartz R, et al. 2007. Dynamic activity of lipid droplets: protein phosphorylation and GTP-mediated protein translocation. J. Proteome Res. 6:3256–3265 - PubMed
    1. Boulant S, Targett-Adams P, McLauchlan J. 2007. Disrupting the association of hepatitis C virus core protein with lipid droplets correlates with a loss in production of infectious virus. J. Gen. Virol. 88:2204–2213 - PubMed

Publication types