. 2012 Apr 6;336(6077):48-51.
doi: 10.1126/science.1218198.

Population genomics of early events in the ecological differentiation of bacteria

Affiliations

Population genomics of early events in the ecological differentiation of bacteria

B Jesse Shapiro et al. Science. .

Abstract

Genetic exchange is common among bacteria, but its effect on population diversity during ecological differentiation remains controversial. A fundamental question is whether advantageous mutations lead to selection of clonal genomes or, as in sexual eukaryotes, sweep through populations on their own. Here, we show that in two recently diverged populations of ocean bacteria, ecological differentiation has occurred akin to a sexual mechanism: A few genome regions have swept through subpopulations in a habitat-specific manner, accompanied by gradual separation of gene pools as evidenced by increased habitat specificity of the most recent recombinations. These findings reconcile previous, seemingly contradictory empirical observations of the genetic structure of bacterial populations and point to a more unified process of differentiation in bacteria and sexual eukaryotes than previously thought.


Figures

Fig. 1
Fig. 1. Phylogeny follows ecology at just a few habitat-specific loci
(A) Maximum-likelihood (ML) V. cyclitrophicus phylogenies rooted by V. splendidus 12B01, based on core genome nucleotide sequence for chromosome I (left) and II (right). Scale is substitutions/site; all nodes have 100% bootstrap support unless indicated. (B) Genome regions with uninterrupted support for (black bars) or against (grey bars; note different scale) the ecological split of strains into distinct habitats (S/L). Bar height indicates the number of informative SNPs in each region. ECO-sup regions 1–11 are described in Table S2; ML trees for 4 major regions are shown, rooted with 12B01; polyL/polyS indicates regions with significantly higher (up arrows) or lower (down arrows) nucleotide diversity and density of segregating polymorphic sites within the L (red) or S (green) habitat, relative to the chromosome-wide average. Tracks below x-axis are as follows. ‘ECO’: locations of ECO-supporting (black points) and -rejecting (grey) SNPs. ‘5-S’: SNPs supporting (blue points) or rejecting (grey) the 5-S branch. ‘Breaks’: number of inferred recombination breakpoints/kb. (C) Tree topologies accounting for most genome length. Top 4 ranked unrooted topologies are shown for chromosome I, top 2 for chromosome II, and the percentage of the core genome accounted for (10).
Fig. 2
Fig. 2. Recent recombination is more common within than between habitats
(A) Genomewide ML phylogeny based on 3.54Mb of aligned core genome, with sister strains highlighted in red/green. All nodes have 79–100 bootstrap support. Bar graphs show events (# of core genome blocks) that split up sisters by recombination between (grey bars) or within habitats (S=green, L=red). (B) Relative amount of shared flexible genomic blocks between strains. The Neighbor-Joining tree (left) is a consensus across 1000 bootstrap resamplings of the flexible blocks. Only nodes with support >500 are shown. Scale bar: Bray-Curtis distance used to construct the NJ tree (10).
Fig. 3
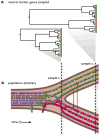
Fig. 3. Ecological differentiation in recombining microbial populations
(A) Example genealogy of neutral marker genes sampled from the population(s) at different times. (B) Underlying model of ecological differentiation. Thin grey or black arrows represent recombination within or between ecologically-associated populations. Thick colored arrows represent acquisition of adaptive alleles for red or green habitats.

Comment in

References

    1. Coleman ML, Chisholm SW. Proc Natl Acad Sci USA. 2010;107:18634. - PMC - PubMed
    1. Papke RT, et al. Proc Natl Acad Sci USA. 2007;104:14092. - PMC - PubMed
    1. Guttman DS, Dykhuizen DE. Genetics. 1994;138:993. - PMC - PubMed
    1. Denef VJ, et al. Proc Natl Acad Sci USA. 2010;107:2383. - PMC - PubMed
    1. Shapiro BJ, David LA, Friedman J, Alm EJ. Trends Microbiol. 2009;17:196. - PubMed

Publication types