. 2012 Sep 7;9(74):2213-24.
doi: 10.1098/rsif.2012.0116. Epub 2012 Apr 4.

Synchrotron-based dynamic computed tomography of tissue motion for regional lung function measurement

Affiliations

Synchrotron-based dynamic computed tomography of tissue motion for regional lung function measurement

Stephen Dubsky et al. J R Soc Interface. .

Abstract

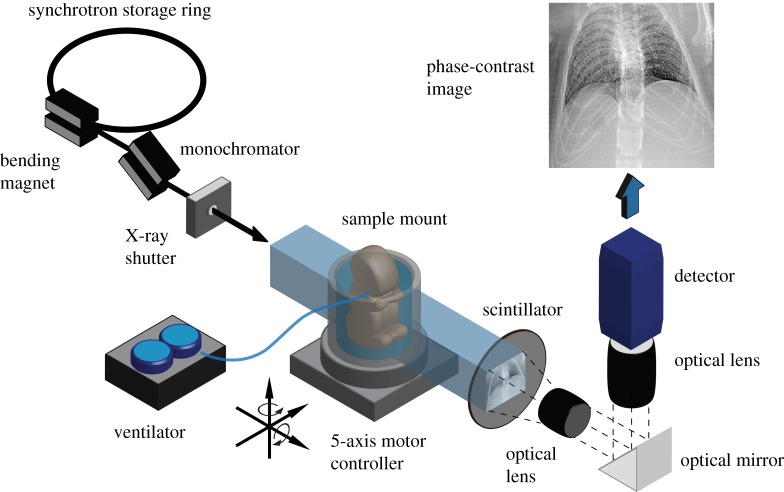
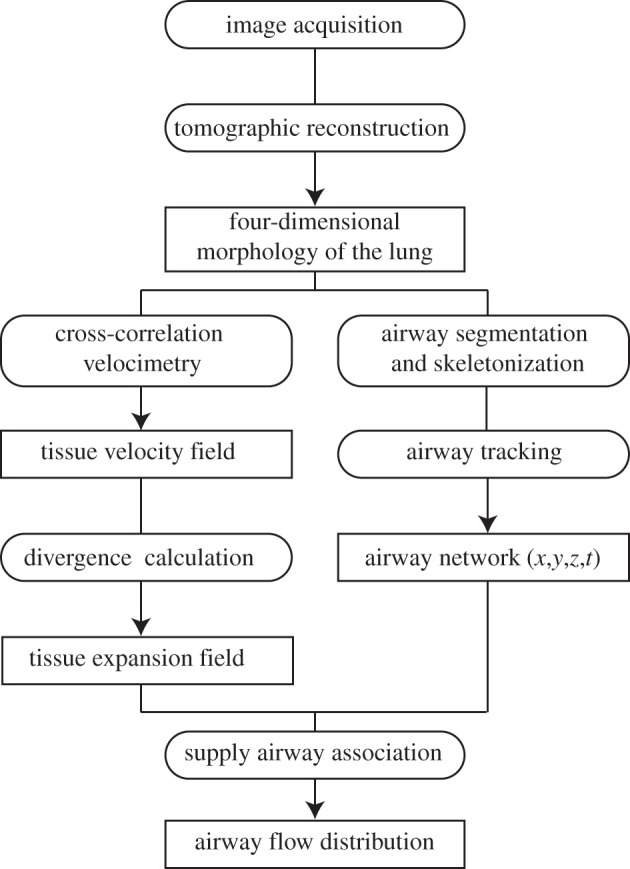
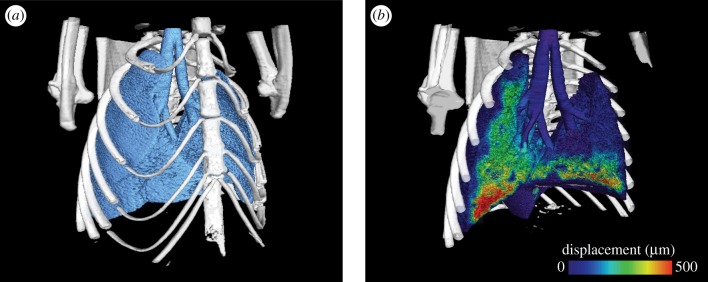
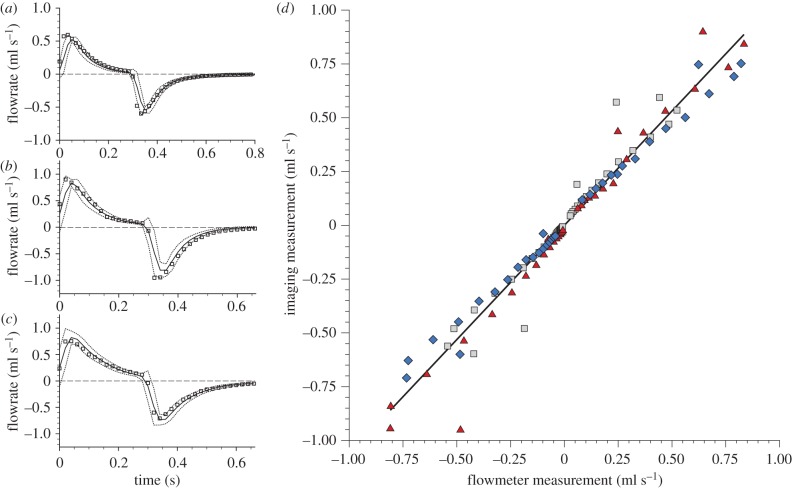
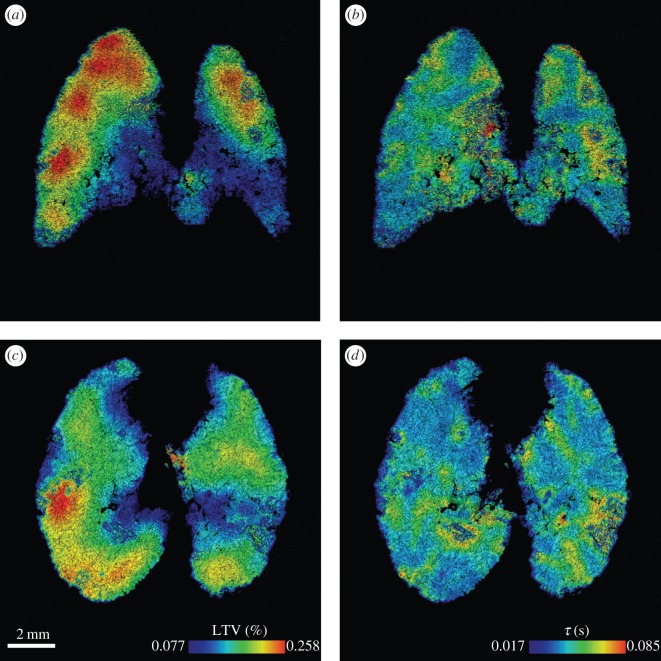
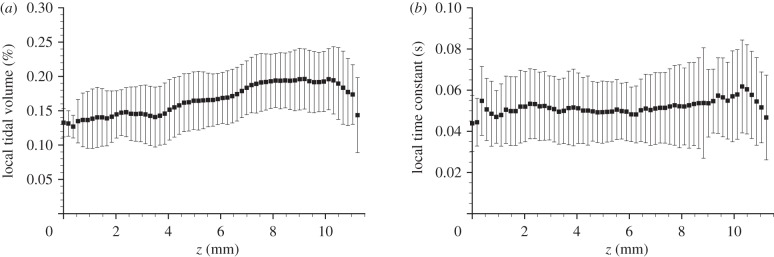
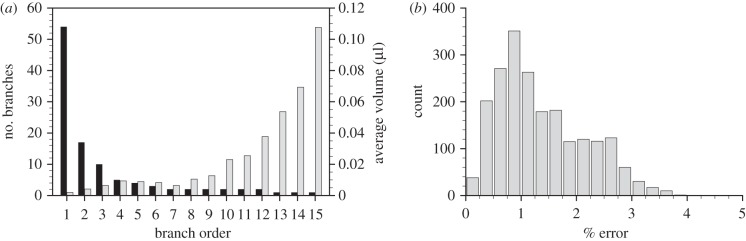
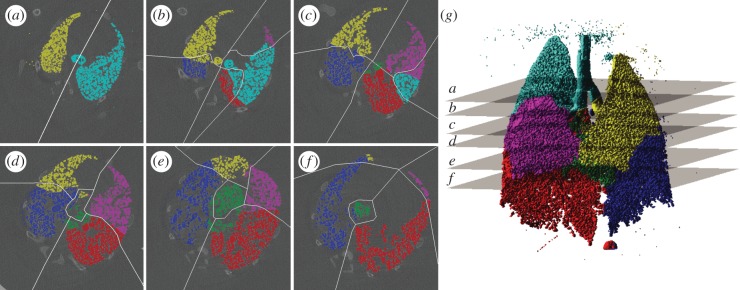
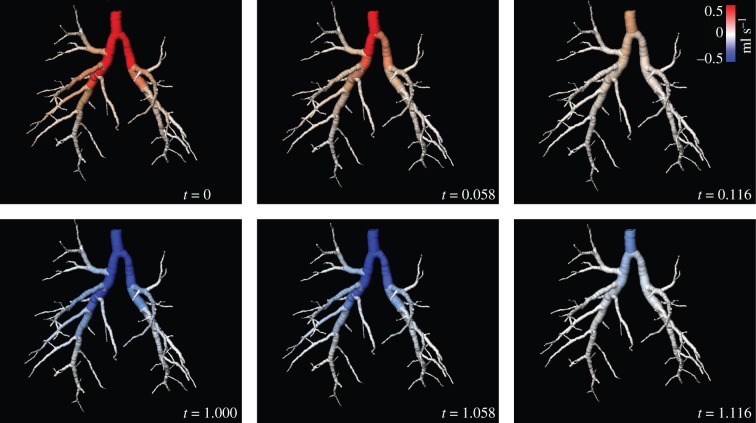
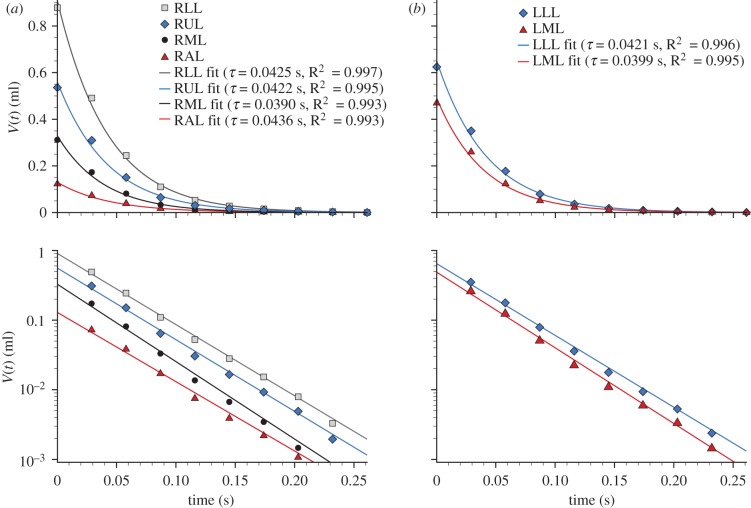
During breathing, lung inflation is a dynamic process involving a balance of mechanical factors, including trans-pulmonary pressure gradients, tissue compliance and airway resistance. Current techniques lack the capacity for dynamic measurement of ventilation in vivo at sufficient spatial and temporal resolution to allow the spatio-temporal patterns of ventilation to be precisely defined. As a result, little is known of the regional dynamics of lung inflation, in either health or disease. Using fast synchrotron-based imaging (up to 60 frames s(-1)), we have combined dynamic computed tomography (CT) with cross-correlation velocimetry to measure regional time constants and expansion within the mammalian lung in vivo. Additionally, our new technique provides estimation of the airflow distribution throughout the bronchial tree during the ventilation cycle. Measurements of lung expansion and airflow in mice and rabbit pups are shown to agree with independent measures. The ability to measure lung function at a regional level will provide invaluable information for studies into normal and pathological lung dynamics, and may provide new pathways for diagnosis of regional lung diseases. Although proof-of-concept data were acquired on a synchrotron, the methodology developed potentially lends itself to clinical CT scanning and therefore offers translational research opportunities.


Figures

Figure 1.
Figure 1.
Schematic of the imaging set-up. Monochromatic X-rays transmit through the sample onto a scintillator, which is imaged using an optical detector system. The animal, ventilated using a self-developed ventilator system, is positioned and aligned using a 5-axis robotic stage. A fast X-ray shutter is used for dose minimization.
Figure 2.
Figure 2.
Flowchart of the image analysis. Four-dimensional movies of the lung morphology are reconstructed from the acquired images. These movies are used to calculate the tissue velocity fields, tissue expansion fields and to segment the airway network for the entire ventilation cycle. The airflow distribution is then calculated by associating regions of tissue with their corresponding supplying airways.
Figure 3.
Figure 3.
(a) Three-dimensional representation of lung morphology and (b) total lung tissue displacement at the end-inspiration for a single time point (end-inspiration) of the four-dimensional dataset for mouse M1. Measurements were acquired at 60 frames s−1, and with a voxel size of 20 µm. Tissue displacement is shown as the total displacement from end-expiration, and half of the data are rendered as transparent to allow visualization. The full movie of both lung morphology and tissue displacement can be viewed in the electronic supplementary material.
Figure 4.
Figure 4.
Flow measurement validation. Flow through the trachea over the entire breath was measured in three mice M1 (a), M2 (b), M3 (c)—using the new imaging method (squares) and compared with flow measured using an inline flowmeter (solid line). (d) Data measured using the imaging method plotted against the flowmeter measurements: M1 (squares), M2 (diamonds), M3 (triangles). A linear regression fit exhibited a gradient of 1.06 and a coefficient of correlation of R2 = 0.96, demonstrating excellent accuracy of the new imaging method.
Figure 5.
Figure 5.
(a,c) Local tidal volume and (b,d) local time constant measured in a newborn rabbit pup. (a,b) A coronal plane and (c,d) transverse plane of the three-dimensional measurement is shown for each parameter with contours chosen to range from the average ±2 s.d. of the three-dimensional dataset.
Figure 6.
Figure 6.
(a) Average expansion and (b) average time constant of horizontal slices of the data presented in figure 5. In these figures, z represents the vertical position with respect to the base of the lung, and the error bars represent ±1 s.d. of the transverse plane. The local expansion exhibits an increase from the base to the apex of the lung, while the the local time constant shows no clear relationship.
Figure 7.
Figure 7.
Airway segmentation and tracking verification. Histogram of the number of branches (black bars) and average supplied volume (grey bars) of air versus Horsfield order (a) exhibiting the expected exponential relationships. Histogram of the error of the airway tracking measurement accumulated over the entire ventilation cycle, and plotted as a percentage of the maximum airway displacement (b). The average percentage error accumulated over the entire breath is 1.36 ±0.8% (s.d).
Figure 8.
Figure 8.
Lung tissue supply airway association. Lobe boundaries manually ascertained in six reconstructed transverse slices at the first time point are shown as white lines (af). Associations defined by the distance criteria scheme are shown as colours (yellow, left upper lobe; blue, left lower lobe; cyan, right upper lobe; magenta, right middle lobe; red, right lower lobe; green, right accessory lobe). The three-dimensional association rendered in (g) illustrates the position of the cross sections used in (af). The accuracy of the distance criteria for allocation of voxels was found to be 91.5%.
Figure 9.
Figure 9.
Distribution of flow throughout the airway tree. Instantaneous flow of air through the rabbit pup airway tree at six time points (out of 20) during ventilation. Positive flow indicates flow into the lungs and negative flow indicates flow out of the lungs. The full movie of this data is shown in the electronic supplementary material.
Figure 10.
Figure 10.
Local expiratory time constant (τ) for each lung lobe. The symbols show the measured volume (relative to end-expiration) for the expiration phase for the lobes in the (a) right and (b) left lungs, and the solid lines show the curve fit used for the time constant calculation. The data are plotted on both (upper) linear and (lower) log scales. RUL, right upper lobe; RML, right middle lobe; RAL, right accessory lobe; RLL, right lower lobe; LML, left middle lobe; LLL, left lower lobe.

References

    1. Weibel E. R. 2009. What makes a good lung? the morphometric basis of lung function. Swiss Med. Wkly 139, 375–386 - PubMed
    1. Faffe D. S., Zin W. A. 2009. Lung parenchymal mechanics in health and disease. Physiol. Rev. 89, 759–77510.1152/physrev.00019.2007 (doi:10.1152/physrev.00019.2007) - DOI - DOI - PMC - PubMed
    1. Frerichs I. 2000. Electrical impedance tomography (EIT) in applications related to lung and ventilation: a review of experimental and clinical activities. Physiol. Measure. 21, R1–R2110.1088/0967-3334/21/2/201 (doi:10.1088/0967-3334/21/2/201) - DOI - DOI - PubMed
    1. Metherall P., Barber D. C., Smallwood R. H., Brown B. H. 1996. Three-dimensional electrical impedance tomography. Nature 380, 509–51210.1038/380509a0 (doi:10.1038/380509a0) - DOI - DOI - PubMed
    1. Victorino J. A., et al. 2004. Imbalances in regional lung ventilation: a validation study on electrical impedance tomography. Am. J. Resp. Crit. Care Med. 169, 791–80010.1164/rccm.200301-133OC (doi:10.1164/rccm.200301-133OC) - DOI - DOI - PubMed

Publication types