Comparative Study
. 2012 Apr 4;32(14):4790-802.
doi: 10.1523/JNEUROSCI.4462-11.2012.

Dendritic BDNF synthesis is required for late-phase spine maturation and recovery of cortical responses following sensory deprivation

Affiliations
Comparative Study

Dendritic BDNF synthesis is required for late-phase spine maturation and recovery of cortical responses following sensory deprivation

Megumi Kaneko et al. J Neurosci. .

Abstract

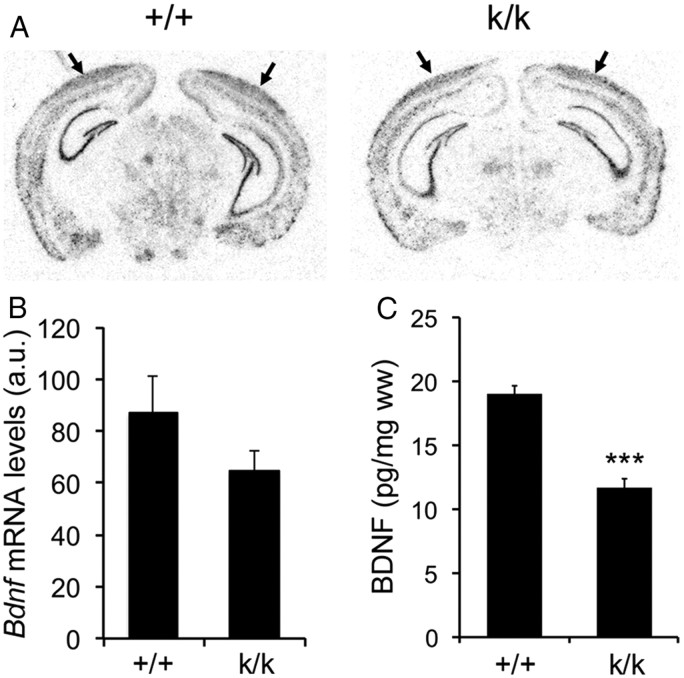
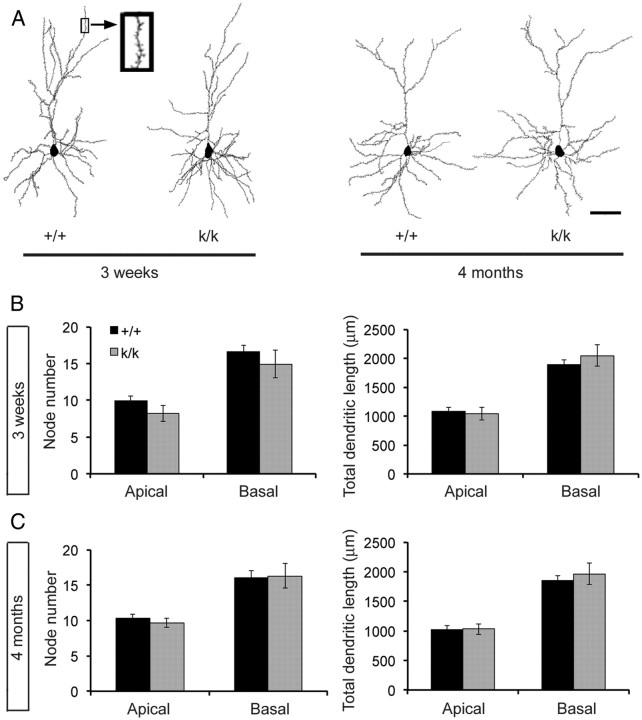
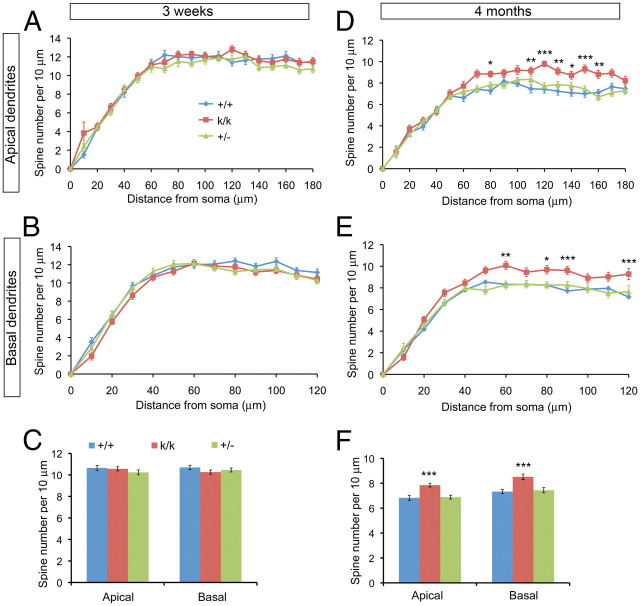
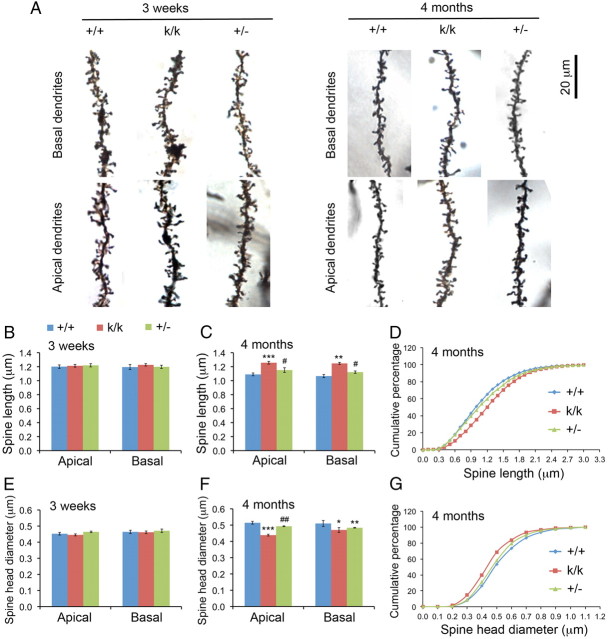
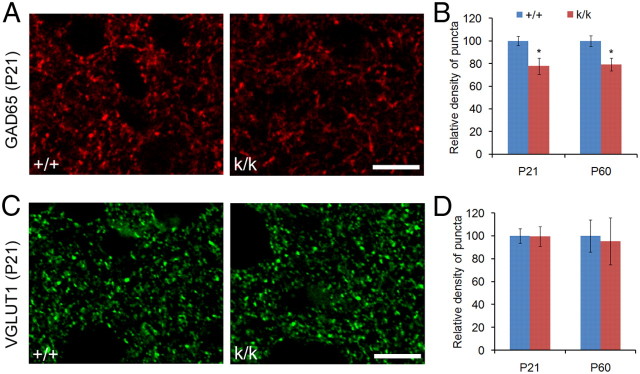
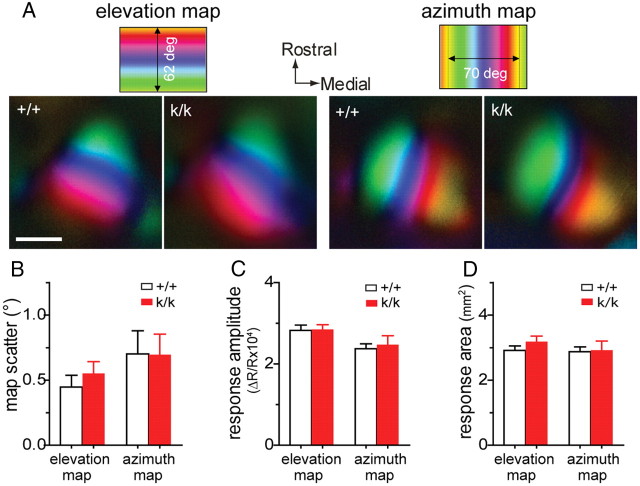
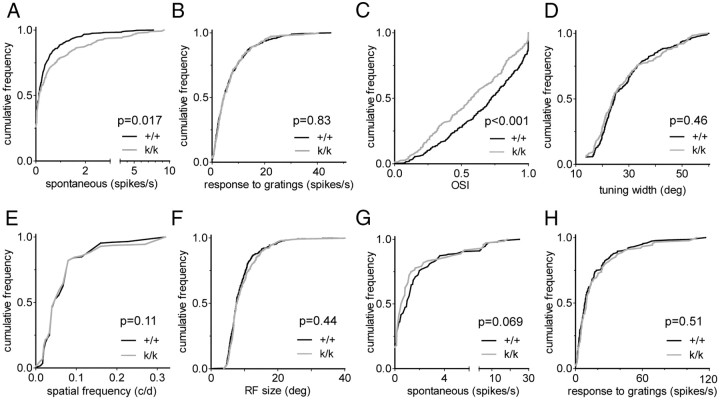
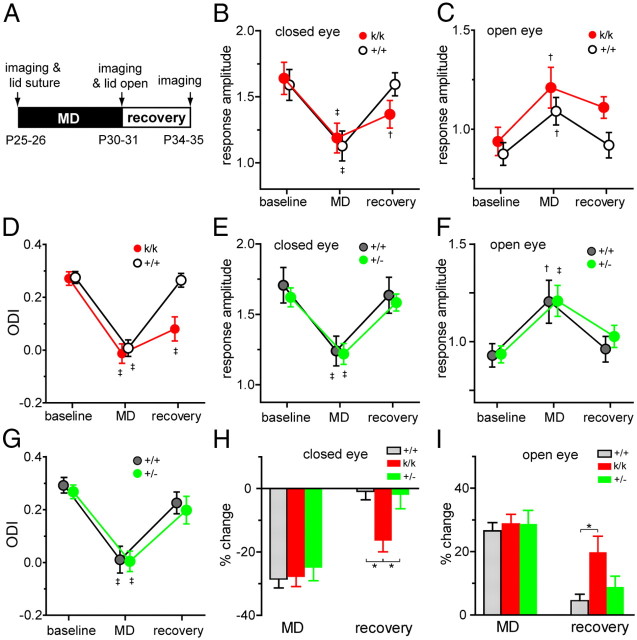
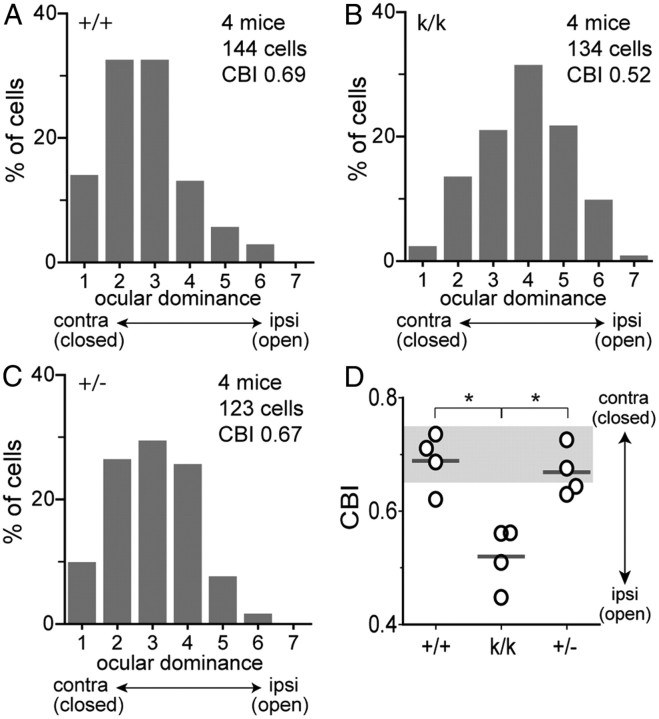
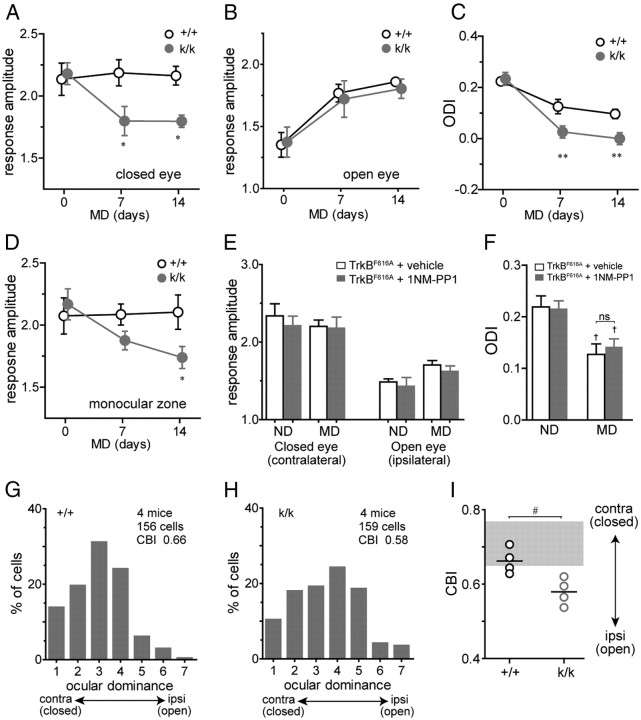
Sensory experience in early postnatal life shapes neuronal connections in the brain. Here we report that the local synthesis of brain-derived neurotrophic factor (BDNF) in dendrites plays an important role in this process. We found that dendritic spines of layer 2/3 pyramidal neurons of the visual cortex in mutant mice lacking dendritic Bdnf mRNA and thus local BDNF synthesis were normal at 3 weeks of age, but thinner, longer, and more closely spaced (morphological features of immaturity) at 4 months of age than in wild-type (WT) littermates. Layer 2/3 of the visual cortex in these mutant animals also had fewer GABAergic presynaptic terminals at both ages. The overall size and shape of dendritic arbors were, however, similar in mutant and WT mice at both ages. By using optical imaging of intrinsic signals and single-unit recordings, we found that mutant animals failed to recover cortical responsiveness following monocular deprivation (MD) during the critical period, although they displayed normally the competitive loss of responsiveness to an eye briefly deprived of vision. Furthermore, MD still induced a loss of responsiveness to the closed eye in adult mutant mice, but not in adult WT mice. These results indicate that dendritic BDNF synthesis is required for spine pruning, late-phase spine maturation, and recovery of cortical responsiveness following sensory deprivation. They also suggest that maturation of dendritic spines is required for the maintenance of cortical responsiveness following sensory deprivation in adulthood.


Figures

Figure 1.
Figure 1.
Levels of Bdnf mRNA and BDNF protein in the cerebral cortex of Bdnfklox/klox mice. A, Representative images of radioactive in situ hybridization of WT (+/+) and Bdnfklox/klox (k/k) coronal brain sections. Arrows denote the visual cortex. The sense probe did not reveal any signals. B, Quantification of radioactive in situ hybridization signal in the visual cortex of +/+ and k/k mice. Error bars indicate SEM. Student's t test, p = 0.253 (4 +/+ mice and 3 k/k mice). a.u., arbitrary unit. C, ELISA analysis of cortical BDNF levels in 5- to 6-week-old +/+ and k/k mice (n = 5 mice per genotype). Error bars indicate SEM. Student's t test, p < 0.001.
Figure 2.
Figure 2.
Layer 2/3 pyramidal neurons in the Bdnfklox/klox visual cortex have normal dendritic arbors. A, Representative dendritic arbors of layer 2/3 pyramidal neurons reconstructed with Neurolucida software from Golgi-impregnated brain sections of WT (+/+) and Bdnfklox/klox (k/k) mice at 3 weeks and 4 months of age. Scale bar, 50 μm. B, Number of dendritic branches and total length of dendrites are normal for layer 2/3 pyramidal neurons in k/k mice at 3 weeks of age. Error bars indicate SEM. C, Number of dendritic branches and total length of dendrites are normal for layer 2/3 pyramidal neurons in k/k mice at 4 months of age. Error bars indicate SEM. Quantification of dendritic arbors was made from 16 reconstructed neurons (4 neurons per mouse) at both ages.
Figure 3.
Figure 3.
Truncation of long Bdnf 3′UTR increases spine density in the mature visual cortex. A, Spine density along apical dendrites of layer 2/3 neurons in the visual cortex of WT (+/+), Bdnfklox/klox (k/k), and Bdnf+/− (+/−) mice at 3 weeks of age. There was a significant effect of genotype on spine density (two-way ANOVA: F(2, 2223) = 6.63, p = 0.0013), but Bonferroni's post-tests did not find significant differences at all distances between genotypes. B, Spine density along basal dendrites of layer 2/3 neurons in the visual cortex of +/+, k/k, and +/− mice at 3 weeks of age. There was a significant effect of genotype on spine density (two-way ANOVA: F(2, 1521) = 8.01, p = 0.0003), but Bonferroni's post-tests did not find significant differences at all distances between genotypes except at 10 μm away from soma between +/+ and k/k. C, Average spine density along apical and basal dendrites of layer 2/3 neurons in the visual cortex of +/+, k/k, and +/− mice at 3 weeks of age. Average spine density in k/k or +/− mice was not significantly different from +/+ mice (+/+ vs k/k: p = 0.774 for apical dendrites and p = 0.129 for basal dendrites; +/+ vs +/−: p = 0.209 for apical dendrites and p = 0.393 for basal dendrites; n = 40 neurons from 4 mice per genotype). D, Spine density along apical dendrites of layer 2/3 neurons in the visual cortex of +/+, k/k, and +/− mice at 4 months of age. There was a significant effect of genotype on spine density (two-way ANOVA: F(2, 2223) = 62.22, p < 0.0001). Bonferroni's post-tests revealed significant differences at 80 and 110–160 μm away from soma between +/+ and k/k mice (*p < 0.05; **p < 0.01; ***p < 0.001). E, Spine density along basal dendrites of layer 2/3 neurons in the visual cortex of +/+, k/k, and +/− mice at 4 months of age. There was a significant effect of genotype on spine density (two-way ANOVA: F(2, 1521) = 38.37, p < 0.0001). Bonferroni's post-tests revealed significant differences at 60, 80, 90, and 120 μm away from soma between +/+ and k/k mice (*p < 0.05; **p < 0.01; ***p < 0.001). F, Average spine density along apical and basal dendrites of layer 2/3 neurons in the visual cortex of +/+, k/k, and +/− mice at 4 months of age. Significantly higher average spine density was found in k/k mice (apical dendrite: p = 0.0001; basal dendrite: p < 0.0001) but not in +/− mice (apical dendrite: p = 0.819; basal dendrite: p = 0.692) compared with +/+ mice (n = 40 neurons from 4 mice per genotype).
Figure 4.
Figure 4.
Adult Bdnfklox/klox mice display long and thin dendritic spines in layer 2/3 neurons of the visual cortex. A, Representative apical and dendritic segments showing spine morphology of WT (+/+), Bdnfklox/klox (k/k), and Bdnf+/− (+/−) mice. B, Spine length at 3 weeks of age. Error bars indicate SEM. C, Spine length at 4 months of age. Error bars indicate SEM. D, Cumulative curves of spine length in +/+, k/k, and +/− mice at 4 months of age. E, Spine head diameter at 3 weeks of age. Error bars indicate SEM. F, Spine head diameter at 4 months of age. Error bars indicate SEM. G, Cumulative curves of spine head diameter in +/+, k/k, and +/− mice at 4 months of age. Four mice per genotype at each time point were used for examination of spine shape. Comparisons with +/+ mice by Student's t test: *p < 0.05; **p < 0.01; ***p < 0.001. Comparisons between k/k and +/− mice by Student's t test: #, p < 0.05; ##, p < 0.01.
Figure 5.
Figure 5.
Density of GAD65-immunoreactive puncta is reduced in the visual cortex of Bdnfklox/klox mice. A, Representative confocal images of GAD65 immunostaining in the visual cortex of WT (+/+) and Bdnfklox/klox (k/k) mice at P21. Scale bars, 10 μm. B, Quantification of GAD65-immunoreactive puncta in the visual cortex of +/+ and k/k mice (n = 6 mice per genotype). Error bars indicate SEM. Student's t test: *p < 0.05. C, Representative confocal images of VGLUT1 immunostaining in the visual cortex of +/+ and k/k mice. Scale bars, 10 μm. D, Quantification of VGLUT1-immunoreactive puncta in the visual cortex of +/+ and k/k mice (n = 6 per genotype). Error bars indicate SEM.
Figure 6.
Figure 6.
Basal response properties of the visual cortex in Bdnfklox/klox mice are normal. A, Examples of topographic maps of the visual cortex in response to the horizontal stripe moving vertically (left, elevation map) and to the vertical bar moving horizontally (right, azimuth map) on the monitor, recorded using intrinsic signal imaging. The color codes on top represent positions of different elevation lines (left) or azimuth line (right) at which specific location of the visual cortex is maximally responsive to the moving stripe. Scale bar, 1 mm. B, Map scatter. To assess the quality of the map, we computed the map scatter by calculating the differences between the phase values of the individual pixels within the visual area to those of their near neighbors. These phase differences would be very small if the maps are “high quality” because of the smooth progression of phases. C, Peak response amplitude presented as fractional change in reflection. D, Response area was calculated by selecting the pixels with the threshold of 30% of the peak amplitude. Error bars represent SEM. N = 4 +/+ mice and 5 k/k mice. There was no significant difference between +/+ and k/k mice (Student's t test).
Figure 7.
Figure 7.
Basal response properties of individual neurons in the visual cortex of Bdnfklox/klox mice. A, Spontaneous firing rates in broad-spiking (putative excitatory) cells (WT: +/+, 295 cells; Bdnfklox/klox: k/k, 274 cells). B, Response rates to the optimal grating (best orientation at best spatial frequency) recorded in the same populations as those in A. C, Orientation selectivity index (OSI) of broad-spiking cells that were responsive to the gratings stimuli (>2 spikes/s). +/+, 240 cells; k/k, 237 cells. D, Orientation tuning width in broad-spiking units that were responsive to the gratings (same populations as in C). E, Preferred spatial frequency in broad-spiking cells responsive to the gratings (same population as in C). F, RF size in broad-spiking cells. RF size was analyzed in selected cells from the population shown in A and B based on responses of >4 spikes/s to the bar with optimal orientation. +/+, 261 cells; k/k, 234 cells. G, Spontaneous firing rates in narrow-spiking (putative inhibitory) cells. +/+, 119 cells; k/k, 88 cells. H, Response rates to the optimal grating of narrow-spiking cells (same populations as in G). All data are presented as the cumulative frequency distribution. P values derived from Kolmogorov–Smirnov tests are indicated in A–H.
Figure 8.
Figure 8.
Bdnfklox/klox mice show impaired recovery of responsiveness after ending MD during the critical period. A, Experimental schedule. B, C, Change in visual cortical responses to the closed eye (B) and to the open eye (C) measured by repeated optical imaging of intrinsic signals, after 5 d of MD followed by 4 d of BV (recovery) in Bdnfklox/klox mice (k/k, n = 6) and WT littermates (+/+, n = 6). D, ODI calculated from data shown in B and C. E, F, Change in visual cortical responses to the closed eye (E) and to the open eye (F) measured by repeated optical imaging of intrinsic signals, after 5 d of MD followed by 4 d of BV (recovery) in Bdnf+/− mice (+/−, n = 4) and their +/+ littermates (n = 4). G, ODI derived from data shown in E and F. H, Percentage change from baseline in closed-eye responses, calculated from data presented in B and E. Two populations of +/+ mice were pooled as there were no significant differences between them. I, Percentage change from baseline in open-eye responses, calculated from data shown in C and F. WT mice in C and F were combined. Data represent mean ± SEM. Response amplitude is expressed as fractional change in reflectance (ΔR/R) × 104. ‡, p < 0.01, †, p < 0.05 compared with baseline, repeated measure ANOVA followed by multiple comparisons with Bonferroni's correction. *p < 0.05 between genotypes, one-way ANOVA followed by multiple comparisons with Bonferroni's correction.
Figure 9.
Figure 9.
Impaired recovery of OD in binocular visual cortex of Bdnfklox/klox mice, examined with electrophysiological single-unit recording. A–C, Distribution of ocular dominance score of individual cells in the binocular visual cortex after 4 d of BV preceded by 5 d of MD in WT (+/+) mice (A) and in Bdnfklox/klox (k/k) mice (B), and in Bdnf+/− (+/−) mice (C). D, CBI for each animal (circles) and group averages (bars), computed from OD scores shown in AC. The shaded area represents the range of CBI in WT animals with normal visual experience at similar ages (Gordon and Stryker, 1996). *p < 0.05 between genotypes by one-way ANOVA followed by multiple comparisons with Bonferroni's correction.
Figure 10.
Figure 10.
Maintenance of cortical responsiveness following visual deprivation is impaired in adult Bdnfklox/klox mice. A, B, Change in response amplitude to the closed eye (A) and open eye (B), measured by chronic optical imaging of intrinsic signals in the binocular visual cortex of Bdnfklox/klox (k/k, n = 6) mice and WT (+/+, n = 5) littermates. MD was started at P75–80. C, Change in the ODI computed from data shown in A and B. D, Change in response amplitude in the monocular visual cortex contralateral to the closed eye in k/k mice (n = 6) and +/+ littermates (n = 5). A–D, **p < 0.01 and *p < 0.05 between genotypes, two-way ANOVA followed by multiple comparisons with Bonferroni's correction. E, Responses to the deprived eye and open eye in the binocular visual cortex of TrkBF616A homozygous mice treated with vehicle solution or 1NM-PP1. Responses were measured in acute experiments in mice with normal visual experience (ND; vehicle: n = 5, 1NM-PP1: n = 5) and in mice after 7–9 d of MD starting at P65–75 (MD; vehicle: n = 6, 1NM-PP1: n = 6). F, ODI of TrkBF616A homozygous mice computed from data shown in E. ns, not significantly different. †, p < 0.05 compared with corresponding ND mice, one-way ANOVA followed by multiple comparisons with Bonferroni's correction. Data in A–F are presented as mean ± SEM G, H, Distribution of the OD score in +/+ (G) and k/k (H) mice after 10–14 d of MD starting at P75–80. I, CBI for each animal (circles) and group averages (bars) calculated from OD scores shown in G and H. The shaded area represents the range of CBI in WT animals with normal visual experience. #, p < 0.05 by Student's t test.

Similar articles

Cited by

References

    1. An JJ, Gharami K, Liao GY, Woo NH, Lau AG, Vanevski F, Torre ER, Jones KR, Feng Y, Lu B, Xu B. Distinct role of long 3′ UTR BDNF mRNA in spine morphology and synaptic plasticity in hippocampal neurons. Cell. 2008;134:175–187. - PMC - PubMed
    1. Barthó P, Hirase H, Monconduit L, Zugaro M, Harris KD, Buzsáki G. Characterization of neocortical principal cells and interneurons by network interactions and extracellular features. J Neurophysiol. 2004;92:600–608. - PubMed
    1. Bartoletti A, Cancedda L, Reid SW, Tessarollo L, Porciatti V, Pizzorusso T, Maffei L. Heterozygous knock-out mice for brain-derived neurotrophic factor show a pathway-specific impairment of long-term potentiation but normal critical period for monocular deprivation. J Neurosci. 2002;22:10072–10077. - PMC - PubMed
    1. Baydyuk M, Russell T, Liao GY, Zang K, An JJ, Reichardt LF, Xu B. TrkB receptor controls striatal formation by regulating the number of newborn striatal neurons. Proc Natl Acad Sci U S A. 2011;108:1669–1674. - PMC - PubMed
    1. Cabelli RJ, Hohn A, Shatz CJ. Inhibition of ocular dominance column formation by infusion of NT-4/5 or BDNF. Science. 1995;267:1662–1666. - PubMed

Publication types

Substances

LinkOut - more resources