Comparative Study
. 2012 Apr 4;32(14):4887-900.
doi: 10.1523/JNEUROSCI.5828-11.2012.

G-protein-coupled receptor 30 mediates rapid neuroprotective effects of estrogen via depression of NR2B-containing NMDA receptors

Affiliations
Comparative Study

G-protein-coupled receptor 30 mediates rapid neuroprotective effects of estrogen via depression of NR2B-containing NMDA receptors

Shui-bing Liu et al. J Neurosci. .

Abstract

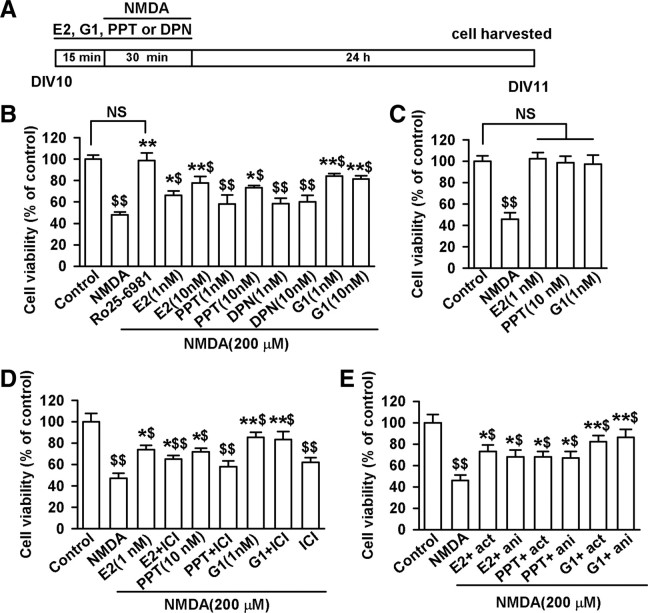
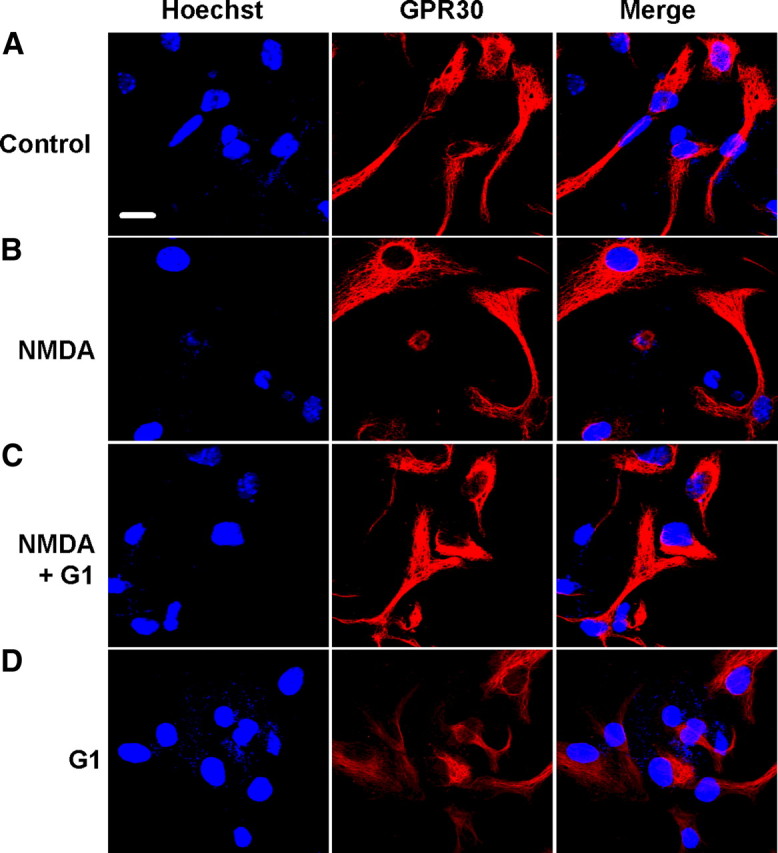
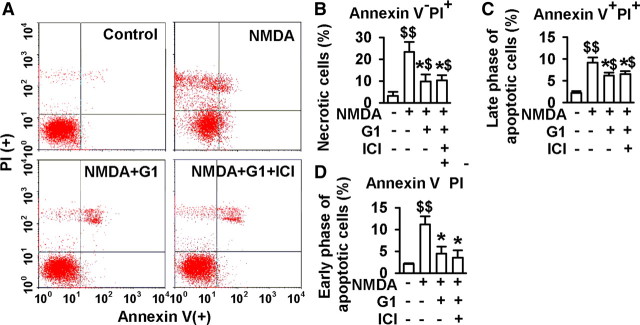
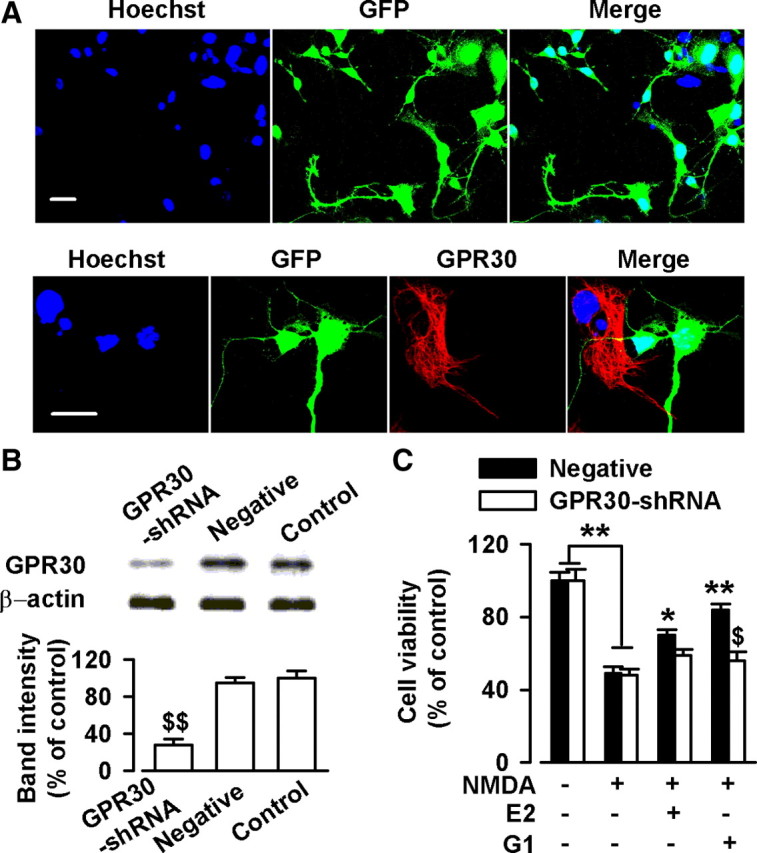
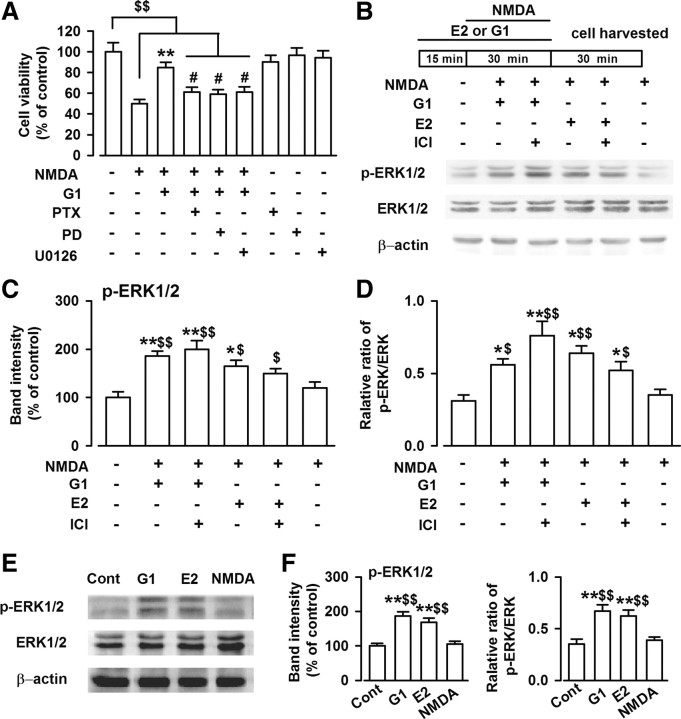
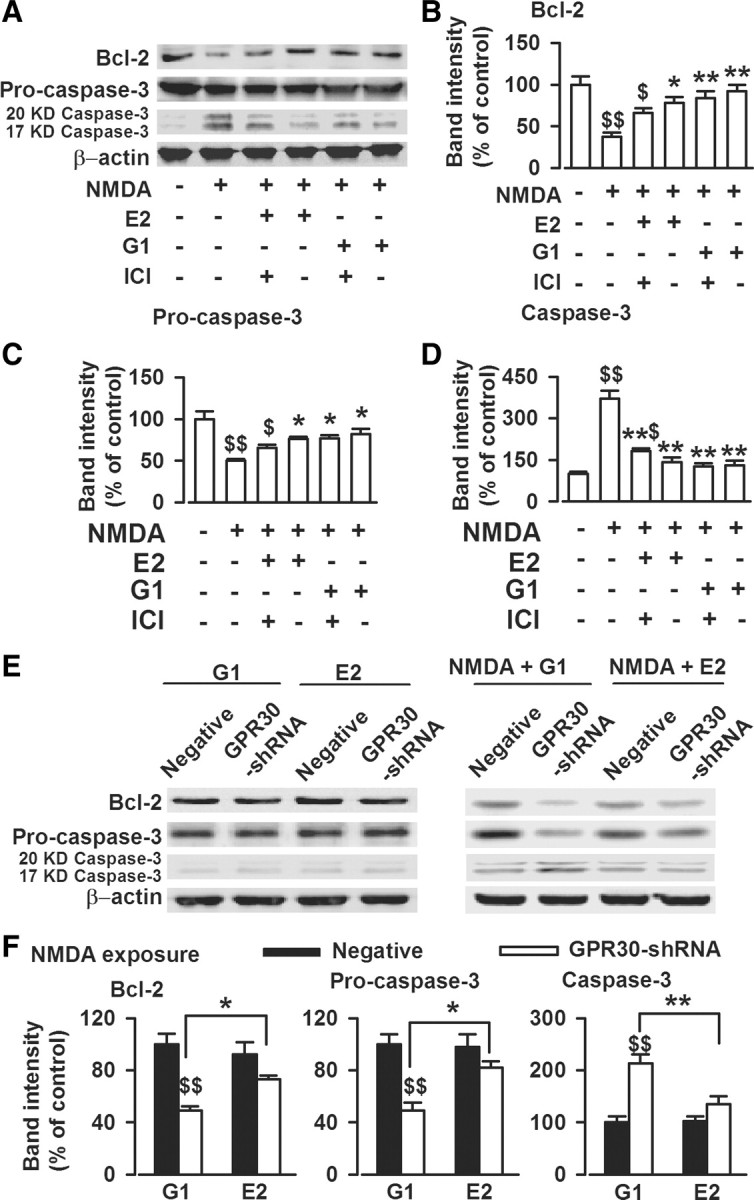
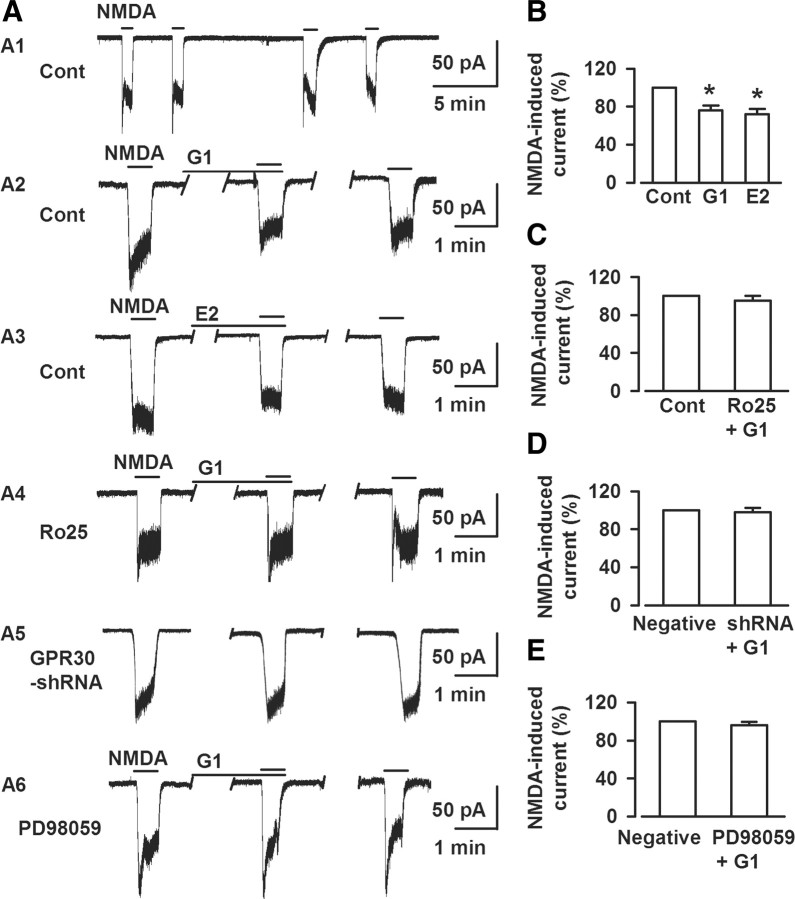
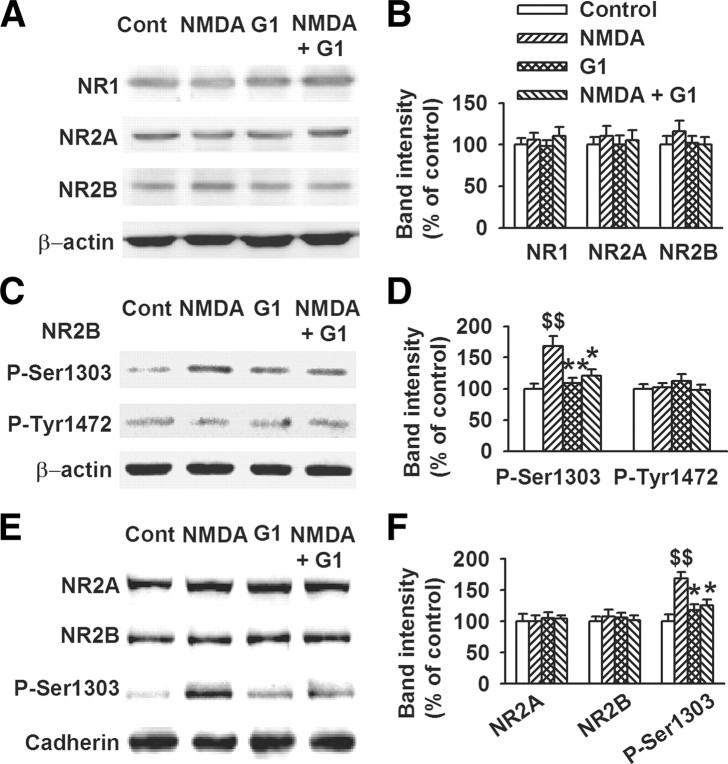
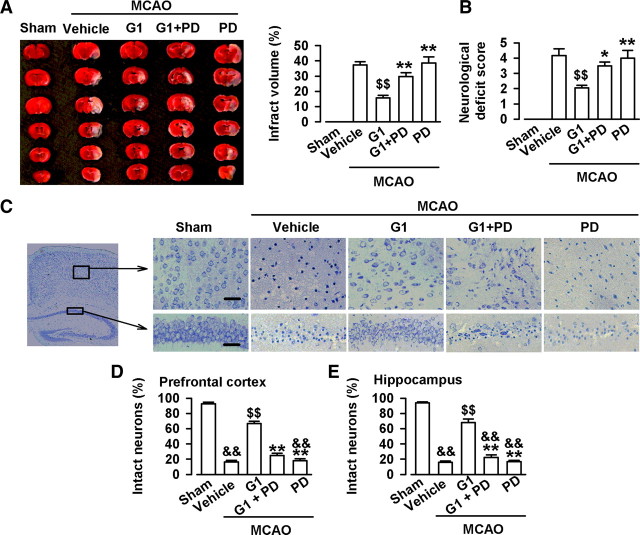
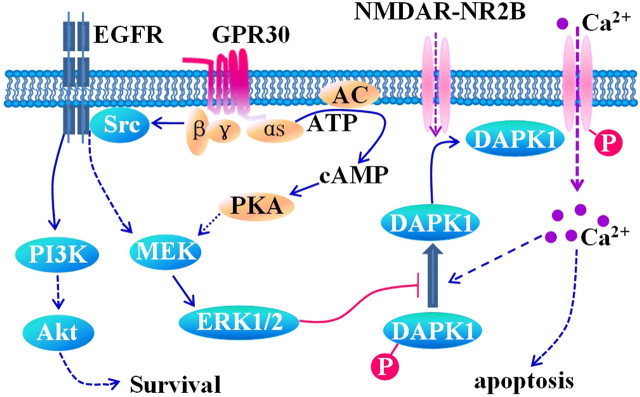
17-β-estradiol (E2) is a steroid hormone involved in neuroprotection against excitotoxicity and other forms of brain injury. Through genomic and nongenomic mechanisms, E2 modulates neuronal excitability and signal transmission by regulating NMDA and non-NMDA receptors. However, the mechanisms and identity of the receptors involved remain unclear, even though studies have suggested that estrogen G-protein-coupled receptor 30 (GPR30) is linked to protection against ischemic injury. In the culture cortical neurons, treatment with E2 and the GPR30 agonist G1 for 45 min attenuated the excitotoxicity induced by NMDA exposure. The acute neuroprotection mediated by GPR30 is dependent on G-protein-coupled signals and ERK1/2 activation, but independent on transcription or translation. Knockdown of GPR30 using short hairpin RNAs (shRNAs) significantly reduced the E2-induced rapid neuroprotection. Patch-clamp recordings revealed that GPR30 activation depressed exogenous NMDA-elicited currents. Short-term GPR30 activation did not affect the expression of either NR2A- or NR2B-containing NMDARs; however, it depressed NR2B subunit phosphorylation at Ser-1303 by inhibiting the dephosphorylation of death-associated protein kinase 1 (DAPK1). DAPK1 knockdown using shRNAs significantly blocked NR2B subunit phosphorylation at Ser-1303 and abolished the GPR30-mediated depression of exogenous NMDA-elicited currents. Lateral ventricle injection of the GPR30 agonist G1 (0.2 μg) provided significant neuroprotection in the ovariectomized female mice subjected to middle cerebral artery occlusion. These findings provide direct evidence that fast neuroprotection by estradiol is partially mediated by GPR30 and the subsequent downregulation of NR2B-containing NMDARs. The modulation of DAPK1 activity by GPR30 may be an important mediator of estradiol-dependent neuroprotection.


Figures

Figure 1.
Figure 1.
Activation of ER subtypes contribute to the neuron viability. Cultures were used for experiments on DIV 10 and cell viability was determined by MTT assay. A, Cells were pretreated with E2, G1, PPT, DPN, or Ro25–6981 for 15 min and then treated with NMDA (200 μm) and glycine (20 μm) for another 30 min. One day later, MTT assay was performed. B, Cytotoxic effects of NMDA were prevented by pretreatment with E2 (1 or 10 nm), G1 (1 or 10 nm), PPT (10 nm), or Ro25–6981 (0.3 μm), but not DPN. C, Treatment of E2 (1 nm), PPT(10 nm), or G1(1 nm) alone without NMDA did not affect cell viability. D, Pretreatment of ICI182780 (10 min, 1 μm) partially reduced neuroprotection of E2 (1 nm), but totally blocked the effect of PPT (10 nm). However, ICI182780 did not affect the neuroprotection of G1. ICI182780 itself had marginal effect on the cell viability. E, Protective effects of E2 (1 nm), PPT (10 nm), or G1 (1 nm) were not blocked by actinomycin-D (act) or anisomycin (ani). $p < 0.05, $$p < 0.01 compared with control; *p < 0.05, **p < 0.01 compared with NMDA treatment alone. NS, No significance.
Figure 2.
Figure 2.
Expression of GPR30 in the cortical neurons. One-day-old NMDA treatment cultures were stained with Hoechst (blue) and anti-GPR30 (red) to identify GPR30 and cellular localization. A–D, Representative confocal images showed the distribution of GPR30 immunoreactivity in the control (A), NMDA (200 μm, B), NMDA plus G1 (200 μm and 1 nm[scap], respectively; C), and G1 (1 nm, D) treatment. GPR30 was localized in the intracellular cytoplasm, including the nuclear envelope in some cases. Expression and distribution of GPR30 were not changed in the NMDA- and G1-treated neurons. Scale bar: 10 μm.
Figure 3.
Figure 3.
Flow cytometry analyses of the apoptosis and necrosis. Cells were pretreated with G1 (1 nm) or G1 (1 nm) plus ICI182780 (1 μm) for 15 min, and then treated with NMDA (250 μm) and glycine (20 μm) for another 30 min. Annexin V and PI double staining was used to separate viable, early-apoptotic, late-apoptotic, and necrotic cells by flow cytometric analysis in 1-d-old cultures. A, Typical representative dot plots of the distribution of viable (annexin V, PI), necrotic (annexin V, PI+), late-phase apoptotic (annexin V+, PI+), and early-phase apoptotic (annexin V+, PI) cells are shown in control (top left), NMDA (top right), NMDA plus G1 (bottom left), and NMDA plus G1 plus ICI182780 (bottom right) treatments. B–D, Percentages of necrotic (B), late-apoptotic (C) and early-apoptotic (D) neurons were calculated from the total neurons. G1 (1 nm) significantly attenuated the necrosis, late-phase apoptosis, and early-phase apoptosis by NMDA stimuli, whereas ICI182780 (1 μm) could not block G1 activity. Values represent mean ± SEM of three independent experiments. $p < 0.05, $$p < 0.01 compared with control; *p < 0.05 compared with NMDA treatment alone.
Figure 4.
Figure 4.
Knockdown of GPR30 depressed estrogen-induced neuroprotection. Cells were treated with GPR30-shRNA for 24 h. A, Confocal images showing the transfection rate of the GPR30-shRNA. Top, Nuclei were stained with Hoechst33258 (blue). GFP-positive neurons indicated the successful knockdown of GPR30 by transfection with GPR30-shRNA. Bottom, Typical neurons showing GPR30-shRNA transfection (green) and nontransfection (red). Scale bars: 20 μm. B, Transfection of GPR30-shRNA resulted in a reduction in GPR30 protein levels; the negative shRNA did not lead to the change of GPR30 expression. $$p < 0.01 compared with the control and negative shRNA. C, Transfection of GPR30-shRNA blocked the neuroprotection of G1 and slightly inhibited the effects of E2. $p < 0.05 compared with G1 treated negative shRNA; *p < 0.05, **p < 0.01 compared with NMDA treatment alone.
Figure 5.
Figure 5.
Activation of ERK1/2 by G1. A, One day after NMDA treatment, MTT assay was performed to detect cell viability. Cotreated cultures with G1, PTX (100 ng/ml), PD98059 (25 μm), or U0126 (10 μm) blocked the protective effect of G1 on the cell viability. PTX, PD98059, or U0126 itself had no effects on the cell viability. B, Thirty minutes after NMDA treatment, the cells were lysed and Western blot analysis was performed using antibodies to detect ERK1/2 and p-ERK1/2 levels. C, E2 (1 nm) and G1 (1 nm) significantly increased phosphorylated level of ERK1/2. ICI182780 (1 μm) had no effects on the ERK1/2 phosphorylation induced by G1; however, ICI182780 slightly depressed ERK1/2 phosphorylation induced by E2. D, E2 (1 nm) and G1 (1 nm) significantly increased the ratio of phosphorylated ERK1/2 to total ERK1/2 levels. ICI182780 (1 μm) had no effects on the change in ratio induced by G1. The data were pooled from five independent experiments. E, Thirty minutes after the E2, G1, and NMDA treatments, the cells were lysed. Western blot analysis was performed using antibodies to detect ERK1/2 and p-ERK1/2 levels. F, NMDA treatment alone had no effects on the p-ERK1/2 levels; however, E2 (1 nm) or G1 (1 nm) alone significantly increased the p-ERK1/2 and ratio of phosphorylated ERK1/2 to total ERK1/2 levels compared to the NMDA treatment alone and the control group. The data were pooled from five independent experiments. #p < 0.05 compared with G1 and NMDA cotreatment; $p < 0.05, $$p < 0.01 compared with control; *p < 0.05, **p < 0.01 compared with NMDA treatment alone.
Figure 6.
Figure 6.
Activation of GPR30 on the expression of apoptosis-related proteins. A, One day after NMDA treatment, the cells were lysed, and Western blot analysis was performed using antibodies to detect Bcl-2, procaspase-3, and caspase-3 (20 and 17 kDa) levels. B, E2 (1 nm) or G1 (1 nm) significantly reversed the decreased Bcl-2 levels caused by NMDA exposure. ICI182780 (1 μm) slightly attenuated the effects of E2, whereas it did not alter the actions of G1. C, E2 (1 nm) and G1 (1 nm) significantly reversed the decreased procaspase-3 levels caused by NMDA exposure. D, E2 (1 nm) and G1 (1 nm) significantly reversed the increased caspase-3 levels caused by NMDA exposure. ICI182780 (1 μm) slightly attenuated the effects of E2, whereas it could not alter the actions of G1. B–D, $p < 0.05, $$p < 0.01 compared with control; *p < 0.05, **p < 0.01 compared with NMDA treatment alone. E, GPR30-shRNA transfection significantly decreased the effects of G1 or E2 on Bcl-2, procaspase-3, and active caspase-3 (20 and 17 kDa) compared with nonsilencing RNA transfection in cultured neurons exposed to NMDA (right). However, G1 and E2 had marginal actions on the expression of Bcl-2, procaspase-3, and active caspase-3 in the cells not exposed to NMDA (left). F, The summary data from the right column of E. GPR30-shRNA transfection significantly attenuated the protection of G1 in a larger scale than that of E2, as shown by greater reduction of in Bcl-2 and procaspase-3. The data were pooled from five independent experiments. $$p < 0.01 compared with G1 treated negative shRNA; *p < 0.05, **p < 0.01 compared between G1 and E2 treatments.
Figure 7.
Figure 7.
Activation of GPR30 blocks NMDA-elicited currents. A, Whole-cell patch-clamp recordings were performed to detect the direct effect of G1 on the NMDA-elicited currents; the recording was stable for at least 30 min (A1). A2–A6, Representative recordings of currents elicited by a 0.5 min superfusion of 50 μm NMDA at baseline and in the presence of G1 (A2), E2 (A3), pretreatment with of Ro25–6981 (A4), GPR30-shRNA transfection (A5), and PD98059 (A6) from the culture neurons. B, Either 1 nm E2 (n = 6) or 1 nm G1 (n = 8) depressed exogenous NMDA-elicited currents. *p < 0.05 compared with the control. C, Pretreatment with Ro25–6981 (0.3 μm) totally blocked the effects of G1 on NMDA-elicited currents (n = 7). D, GPR30-shRNA transfection blocked the effects of G1 on NMDA-elicited currents (n = 8). E, PD98059 (25 μm) blocked the effects of G1 on NMDA-elicited currents (n = 6).
Figure 8.
Figure 8.
Depression of NR2B subunit phosphorylation by GPR30. Cells were pretreated with G1 (1 nm) for 15 min and then cotreated with NMDA (200 μm) and glycine (20 μm) for another 30 min. A, Six hours after NMDA treatment, Western blot analysis was performed using antibodies against NR1, NR2A, and NR2B. B, GPR30 activation by G1 (1 nm, 45 min) did not affect the total NR1, NR2A, and NR2B expression. C, Western blot analysis was performed to detect the phosphorylated NR2B. D, GPR30 activation by G1 (1 nm, 45 min) depressed the levels of phosphorylated NR2B at Ser-1303 (p-Ser1303-NR2B), but not at (p-Tyr1472-NR2B). E, Detection of the membrane surface expression of NMDARs subunits. F, Only the membrane surface expression of NR2B-p-Ser1303 and not the total levels of NR2A and NR2B were affected by the G1 and NMDA treatments. The data were pooled from five independent experiments. $$p < 0.01 compared with control; *p < 0.05, **p < 0.01 compared with NMDA treatment alone.
Figure 9.
Figure 9.
Depression of DAPK1 dephosphorylation by GPR30. A, Thirty minutes after NMDA treatment, the cells were lysed, and Western blot analysis was performed to detect the p-DAPK1 and DAPK1 levels. NMDA exposure resulted in the significant dephosphorylation of p-DAPK1 into DAPK1. G1 (1 nm) inhibited p-DAPK1 dephosphorylation, whereas PD98059 (25 μm) abolished the effects of G1 on DAPK1 and NR2B phosphorylation. The data were pooled from five independent experiments. $$p < 0.01 compared with the control; **p < 0.01 compared with NMDA treatment alone; &&p < 0.01 compared with G1 plus NMDA. B, RDEA119 (1 μm) or JTP-74057 (0.1 μm) abolished the effects of G1 on DAPK1 and NR2B phosphorylation. The data were pooled from five independent experiments. $$p < 0.01 compared with the control; *p < 0.05, **p < 0.01 compared with NMDA treatment alone; &p < 0.05, &&p < 0.01 compared with G1 plus NMDA. C, Confocal images showing the transfection rate of the DAPK1-shRNA. Top, Nuclei were stained with Hoechst33258 (blue). GFP-positive neurons indicated the successful knockdown of DAPK1 by transfection of DAPK1-shRNA. Bottom, Typical neurons showing DAPK1-shRNA transfection (green) and nontransfection (red). Scale bars: 20 μm. D, DAPK1-shRNA transfection resulted in a reduction in DAPK1 protein levels; the negative shRNA did not change of DAPK1 expression. **p < 0.01 compared with the control and negative shRNA. E, DAPK1 knockdown significantly depressed the phosphorylation of the NR2B subunit at Ser-1303 induced by NMDA exposure. F, DAPK1-shRNA transfection prevented the neurotoxicity of NMDA exposure. $$p < 0.01 compared with the control; **p < 0.01 compared with NMDA treatment alone and negative shRNA. G–H, DAPK1-shRNA transfection abolished the effects of G1 on NMDA-elicited currents (n = 7).
Figure 10.
Figure 10.
Neuroprotection by GPR30 in vivo. A, Representative photographs of infarct volume after the MACO and treatments with vehicle (10% DMSO, 2 μl), G1 (0.2 μg), and PD98059 (0.5 μg). n = 6 in each group. B, G1 (0.2 μg) significantly reduced the neurological deficit score after MCAO. PD98059 (0.5 μg) reversed the effect of G1. C, Nissl staining showing the morphologic neuronal changes in the hippocampus CA1 region and prefrontal cortex. Scale bars: 50 μm. D, G1 (0.2 μg) significantly reduced the injury in the hippocampus CA1 region. E, G1 (0.2 μg) significantly reduced the injury in the prefrontal cortex. n = 6 in each group. &&p < 0.01 compared with the sham; $$p < 0.01compared with the vehicle; *p < 0.05, **p < 0.01 compared with G1.
Figure 11.
Figure 11.
Schematic of GPR30-mediated signaling. GPR30, a G-protein-coupled receptor, activates heterotrimeric G-proteins, which in turn activates multiple effectors, including adenylyl cyclase (resulting in cAMP production), the phosphorylation of ERK1/2, and Src. The latter appears to be involved in the activation of transactivation of EGFRs via a G-protein-dependent pathway. The activated ERK by GPR30 agonist inhibits p-DAPK1 from dephosphorylating to the active form (DAPK1). This leads to the inhibition of active DAPK1 binding with the NR2B, and then phosphorylated NR2B at Ser-1303. The phosphorylated NR2B at Ser-1303 enhances the function of NMDARs, which causes the overload of Ca2+. The GPR30 is also shown to directly activate the PI3K/Akt survival signaling cascades.

Similar articles

Cited by

References

    1. Abe H, Keen KL, Terasawa E. Rapid action of estrogens on intracellular calcium oscillations in primate luteinizing hormone-releasing hormone-1 neurons. Endocrinology. 2008;149:1155–1162. - PMC - PubMed
    1. Anjum R, Roux PP, Ballif BA, Gygi SP, Blenis J. The tumor suppressor DAP kinase is a target of RSK-mediated survival signaling. Curr Biol. 2005;15:1762–1767. - PubMed
    1. Arundine M, Tymianski M. Molecular mechanisms of calcium-dependent neurodegeneration in excitotoxicity. Cell Calcium. 2003;34:325–337. - PubMed
    1. Bae YH, Hwang JY, Kim YH, Koh JY. Anti-oxidative neuroprotection by estrogens in mouse cortical cultures. J Korean Med Sci. 2000;15:327–336. - PMC - PubMed
    1. Barneda-Zahonero B, Miñano-Molina A, Badiola N, Fadó R, Xifró X, Saura CA, Rodríguez-Alvarez J. Bone morphogenetic protein-6 promotes cerebellar granule neurons survival by activation of the MEK/ERK/CREB pathway. Mol Biol Cell. 2009;20:5051–5063. - PMC - PubMed

Publication types

MeSH terms