. 2012 Jul;64(7):2268-77.
doi: 10.1002/art.34495.

Synovial fluid from patients with early osteoarthritis modulates fibroblast-like synoviocyte responses to toll-like receptor 4 and toll-like receptor 2 ligands via soluble CD14

Affiliations

Synovial fluid from patients with early osteoarthritis modulates fibroblast-like synoviocyte responses to toll-like receptor 4 and toll-like receptor 2 ligands via soluble CD14

Anjali Nair et al. Arthritis Rheum. 2012 Jul.

Abstract

Objective: Synovial inflammation, a feature of both osteoarthritis (OA) and meniscal injury, is hypothesized to be triggered in part via stimulation of Toll-like receptors (TLRs). We undertook this study to test whether a TLR-2- or TLR-4-stimulating factor in synovial fluid (SF) from patients with early knee OA with meniscal injury could lead to inflammatory activation of synoviocytes.

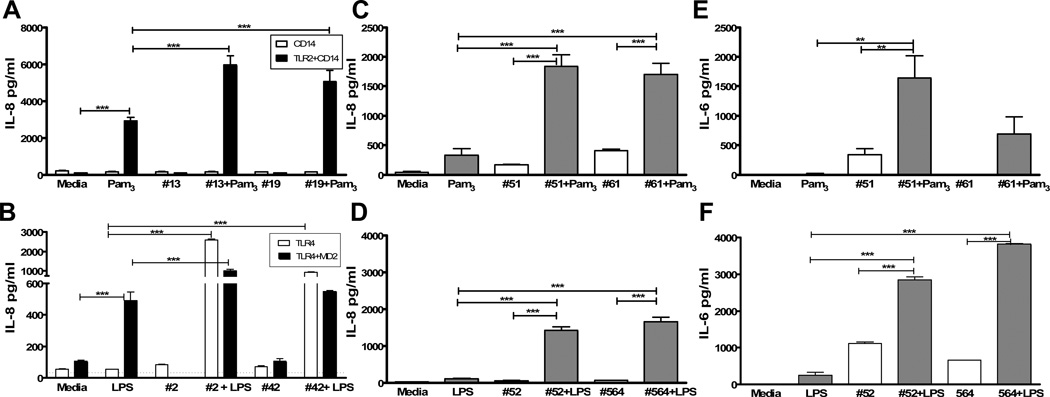
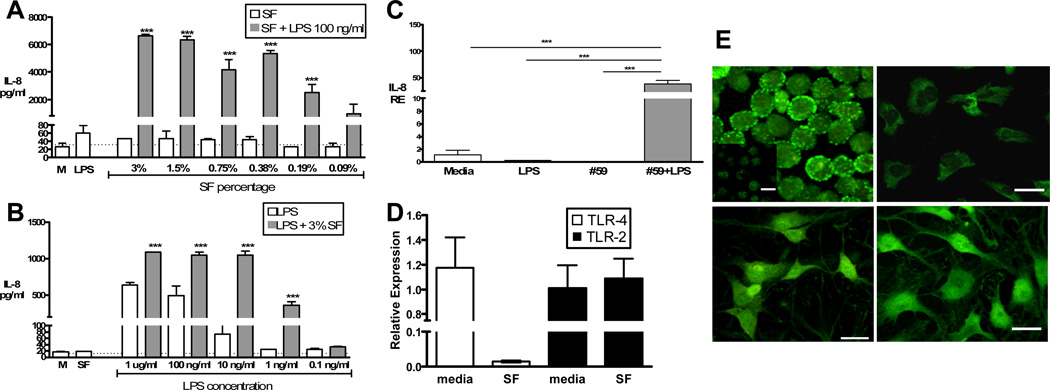
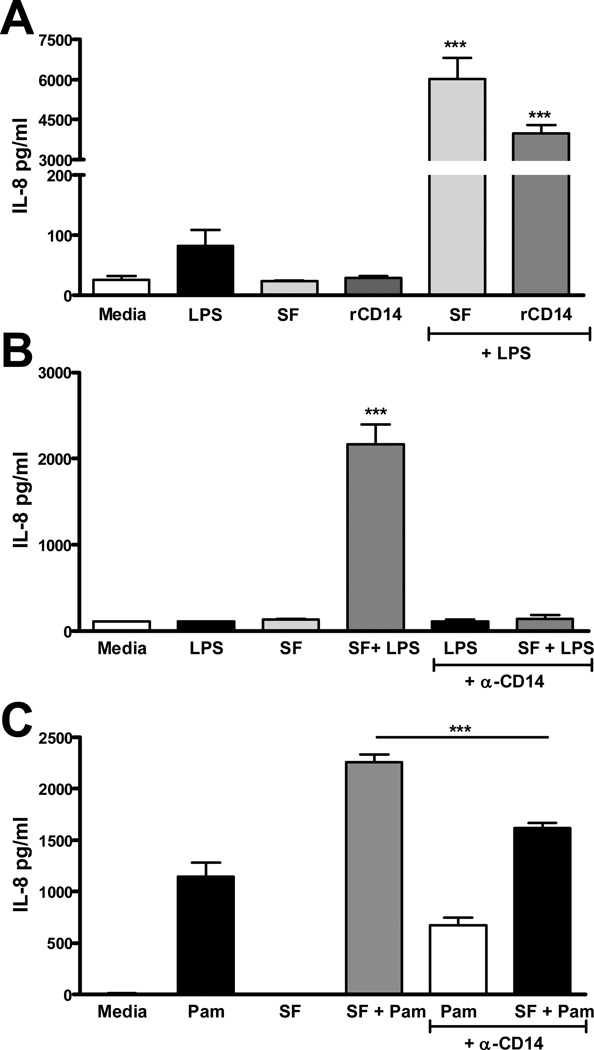
Methods: SF was obtained from patients with early OA cartilage damage undergoing arthroscopic meniscal procedures. SF was used to stimulate primary cultures of fibroblast-like synoviocytes (FLS) and cell lines transfected with TLR-2 or TLR-4. SF was used either alone or in combination with a TLR-2 stimulus (palmitoyl-3-cysteine-serine-lysine-4 [Pam3CSK4]) or a TLR-4 stimulus (lipopolysaccharide [LPS]). In blocking experiments, SF was preincubated with anti-CD14 antibody.

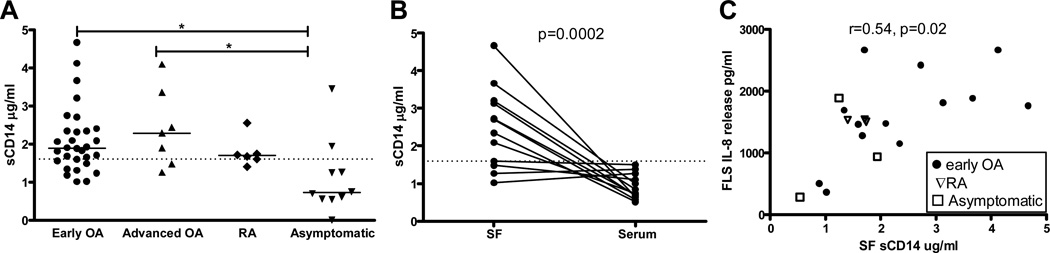
Results: SF from these patients did not stimulate interleukin-8 (IL-8) release from TLR transfectants. Compared with SF on its own, SF (at concentrations of 0.09-25%) in combination with TLR-2 or TLR-4 ligands resulted in significant augmentation of IL-8 release from both transfectants and primary FLS. Soluble CD14 (sCD14), a coreceptor for TLRs, was measured in SF from patients with early OA at levels comparable to those in patients with advanced OA and patients with rheumatoid arthritis. Blockade with anti-CD14 antibody abolished the ability of SF to augment IL-8 production in response to LPS, and diminished Pam3CSK4 responses.

Conclusion: SF augments FLS responses to TLR-2 and TLR-4 ligands. This effect was largely due to sCD14. Our results demonstrate that sCD14 in the setting of OA and meniscal injury sensitizes FLS to respond to inflammatory stimuli such as TLR ligands.


Figures

Figure 1
Figure 1
SF augments responses to TLR-2 (Pam3CysK4, A, C, E), and TLR-4 (LPS, B, D, F) ligands in both HEK-293 transfected cell lines (A & B) and primary FLS cultures (C–F). Cells were stimulated as described with 25% SF (listed by specimen #), Pam3 (Pam3CysK4 100–500ng/ml, A, C, E), LPS (100ng/ml, B, D, F), or SF + Pam3 or LPS in duplicate or triplicate wells. For A, white bars represent HEK-293 cells transfected with CD14, black bars are cells transfected with both TLR-2 and CD14. Similarly, for B, white bars represent HEK-293 cells transfected with TLR-4, and black bars are cells transfected with both TLR-4 and MD-2. After 18 hours, IL-8 was measured by ELISA in culture supernatants. C–F: FLS cells were stimulated similarly to the HEK-293 cells. C & D: FLS IL-8 production and E & F: IL-6 production after 18 hours. Results shown are representative of 2–3 separate experiments. *** p<0.001, ** p<0.01.
Figure 2
Figure 2
Cells were stimulated as described with A: SF in decreasing percentages alone (white bars) or with LPS 100ng/ml (grey bars); or B: LPS in decreasing concentrations alone (white bars) or with 3% SF (grey bars), all in duplicate. M = Media control, Dotted line = ELISA limit of detection. *** p <0.001 compared to both SF or LPS alone. C: IL-8 mRNA levels (RE = Relative Expression) measured by qPCR after six hour stimulation with 3% SF #59 with or without 100ng/ml LPS. *** p <0.001. D: mRNA levels of TLR-4 (white) and TLR-2 (black) after six hour stimulation with or without 3% SF #59. Expression levels were calculated relative to media control. Results in A–D are representative of two separate experiments. E: Two-photon images of TLR-4 staining. Top left: Positive control, TLR-4 staining of HEK-TLR4 transfectants (isotype control staining shown in inset). Top right: Unstimulated FLS culture stained with isotype control mAb (mean fluorescence intensity, MFI arbitrary units = 61.4+/− 30.0). Bottom left: TLR-4 staining of unstimulated FLS (MFI = 173.0 +/− 25.8). Bottom right: TLR-4 staining of FLS stimulated with 3% SF (MFI = 179.7 +/− 21.9). White scale bars = 20mm.
Figure 3
Figure 3
SF soluble CD14 (sCD14) levels in early OA patients are (A) comparable to levels observed in advanced OA and Rheumatoid Arthritis, (B) elevated in SF compared with serum, and (C) correlate with SF augmentation of FLS LPS response. A: SF sCD14 in early OA patients undergoing meniscectomy (n=30), advanced OA patients undergoing total knee replacement (n=7) and RA patients undergoing TKR (n=6), as well as asymptomatic organ donors without known joint disease (n=10) were measured by ELISA (see Table 1 for patient characteristics). *P< 0.05 (Kruskal-Wallis) compared with asymptomatic donors. B: In early OA patients undergoing meniscectomy, SF levels were higher than in paired serum specimens (Mann-Whitney p=0.0002). Dotted line = level in pooled, normal human serum. C: FLS were stimulated for 18 hours as described in Materials and Methods with LPS (100ng/ml) + SF (0.2%) from patients with early OA (n=12, circles), RA (n=3, triangles), and asymptomatic controls (n=3, squares). IL-8 levels measured in supernatants after stimulation correlated with sCD14 levels in the SF (Spearman rho = 0.54, p = 0.02).
Figure 4
Figure 4
Addition of recombinant CD14 augments response of FLS to LPS (A) and incubation with anti-CD14 abrogates SF augmentation of both the LPS (B) and Pam3CysK4 (C) response. In A, primary FLS were stimulated as described with LPS 100ng/ml, 25% SF#21, rCD14 0.5ug/ml (expected concentration in 25% SF), SF + LPS, or rCD14 + LPS. Results are representative of two experiments. *** p<0.001 compared with all other groups. In B and C 1.5% SF#59, 100ng/ml LPS (B) or Pam3CysK4 (C) was pre-incubated with monoclonal anti-CD14 (clone MEM-18) prior to incubation with FLS cells. The anti-CD14 itself had no effect on IL-8 on its own (data not shown). *** p<0.001.compared to all other groups (B), or as indicated (C).

Comment in

References

    1. Guermazi A, Roemer FW, Hayashi D, Crema MD, Niu J, Zhang Y, et al. Assessment of synovitis with contrast-enhanced MRI using a whole-joint semiquantitative scoring system in people with, or at high risk of knee osteoarthritis: the MOST study. Ann Rheum Dis. 2010;70(5):805–811. - PMC - PubMed
    1. Hill CL, Hunter DJ, Niu J, Clancy M, Guermazi A, Genant H, et al. Synovitis detected on magnetic resonance imaging and its relation to pain and cartilage loss in knee osteoarthritis. Ann Rheum Dis. 2007;66(12):1599–1603. - PMC - PubMed
    1. Torres L, Dunlop DD, Peterfy C, Guermazi A, Prasad P, Hayes KW, et al. The relationship between specific tissue lesions and pain severity in persons with knee osteoarthritis. Osteoarthritis Cartilage. 2006;14(10):1033–1040. - PubMed
    1. Roemer FW, Zhang Y, Niu J, Lynch JA, Crema MD, Marra MD, et al. Tibiofemoral joint osteoarthritis: risk factors for MR-depicted fast cartilage loss over a 30-month period in the multicenter osteoarthritis study. Radiology. 2009;252(3):772–780. - PMC - PubMed
    1. Sakkas LI, Scanzello C, Johanson N, Burkholder J, Mitra A, Salgame P, et al. T cells and T-cell cytokine transcripts in the synovial membrane in patients with osteoarthritis. Clin Diagn Lab Immunol. 1998;5(4):430–437. - PMC - PubMed

Publication types

MeSH terms