. 2012 May;139(9):1599-610.
doi: 10.1242/dev.078097.

Loss of Llgl1 in retinal neuroepithelia reveals links between apical domain size, Notch activity and neurogenesis

Affiliations

Loss of Llgl1 in retinal neuroepithelia reveals links between apical domain size, Notch activity and neurogenesis

Brian S Clark et al. Development. 2012 May.

Abstract

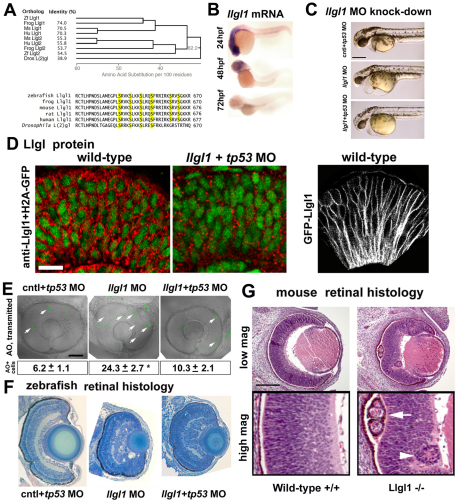
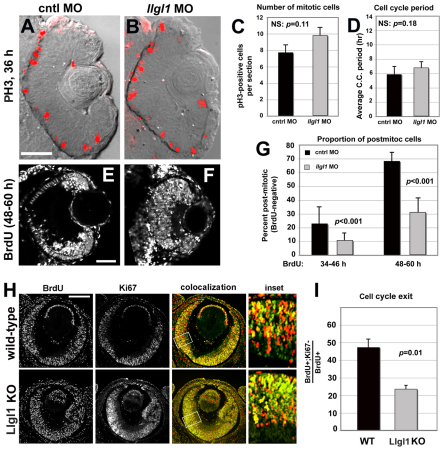
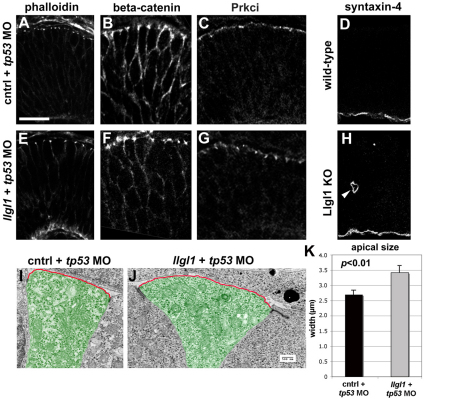
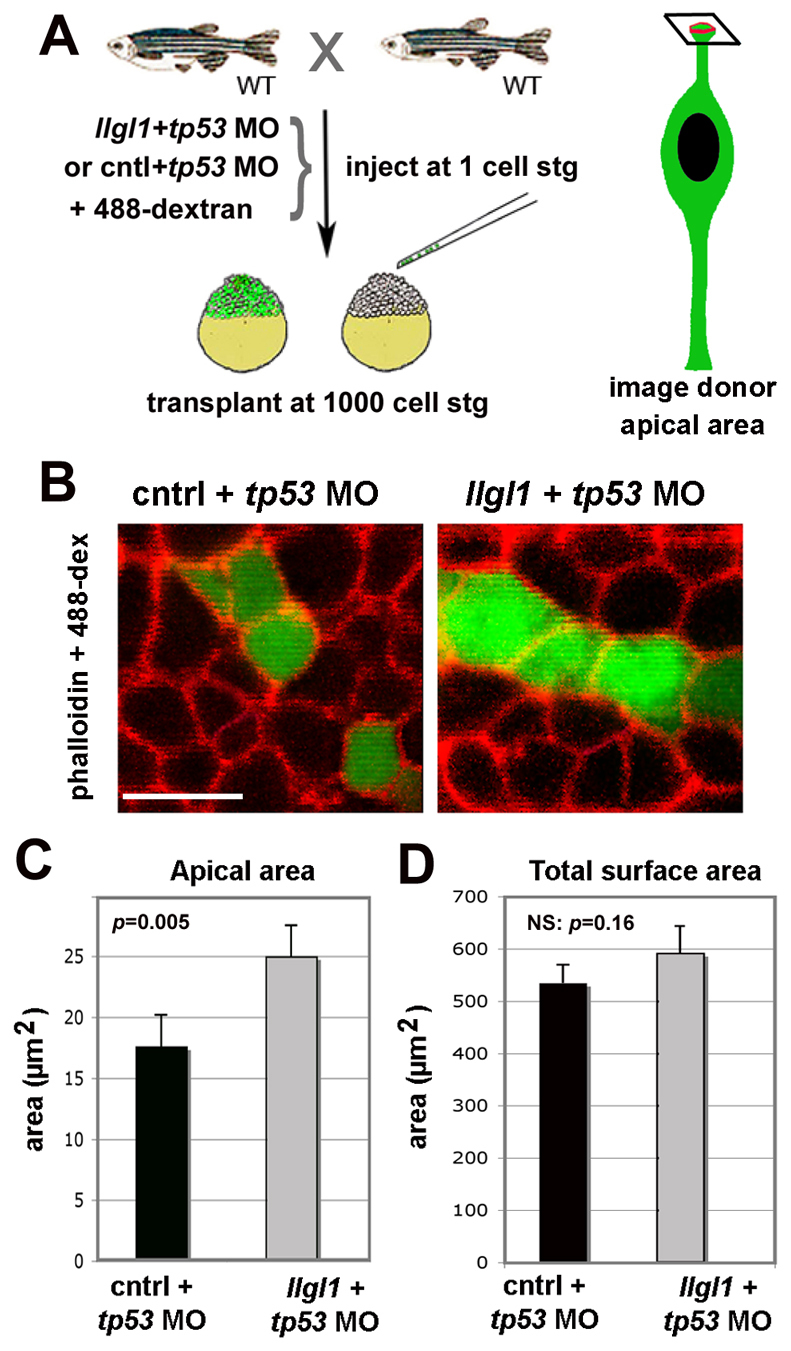
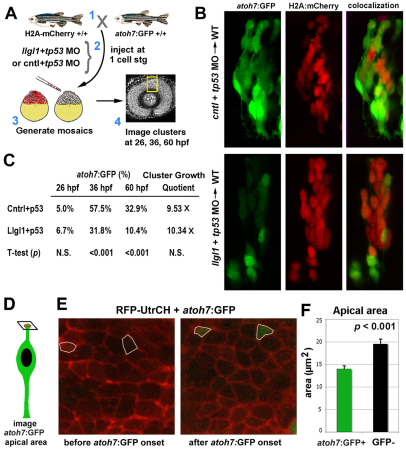
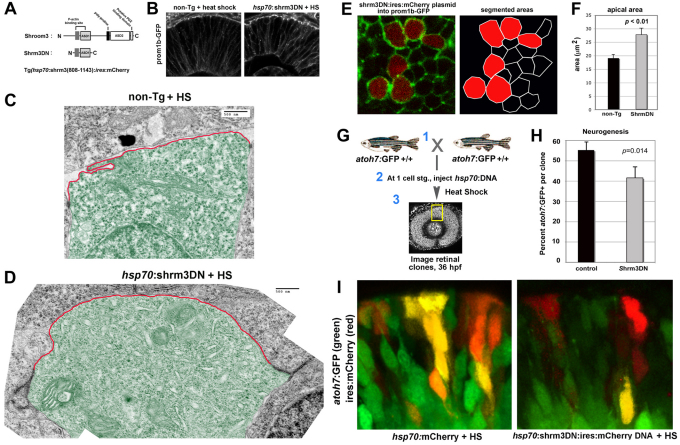
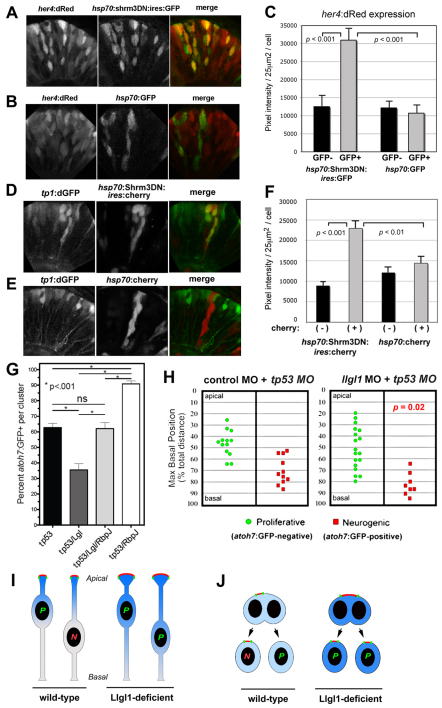
To gain insights into the cellular mechanisms of neurogenesis, we analyzed retinal neuroepithelia deficient for Llgl1, a protein implicated in apicobasal cell polarity, asymmetric cell division, cell shape and cell cycle exit. We found that vertebrate retinal neuroepithelia deficient for Llgl1 retained overt apicobasal polarity, but had expanded apical domains. Llgl1 retinal progenitors also had increased Notch activity and reduced rates of neurogenesis. Blocking Notch function by depleting Rbpj restored normal neurogenesis. Experimental expansion of the apical domain, through inhibition of Shroom3, also increased Notch activity and reduced neurogenesis. Significantly, in wild-type retina, neurogenic retinal progenitors had smaller apical domains compared with proliferative neuroepithelia. As nuclear position during interkinetic nuclear migration (IKNM) has been previously linked with cell cycle exit, we analyzed this phenomenon in cells depleted of Llgl1. We found that although IKNM was normal, the relationship between nuclear position and neurogenesis was shifted away from the apical surface, consistent with increased pro-proliferative and/or anti-neurogenic signals associated with the apical domain. These data, in conjunction with other findings, suggest that, in retinal neuroepithelia, the size of the apical domain modulates the strength of polarized signals that influence neurogenesis.


Figures

Fig. 1.
Fig. 1.
Loss of Llgl1 disrupts retinal development. (A) Phylogenetic comparison of Llgl proteins showing percentage identity (left, top) and cladogram when compared with zebrafish Llgl1 (right, top). Sequence comparison (bottom) showing conservation of serines known to be phosphorylated. (B) In situ hybridization of llgl1 mRNA in zebrafish embryos at 24, 48 and 72 hours post-fertilization (hpf). (C) Side views of morphant embryos at 36 hpf: 8 ng control+ 8ng tp53 morpholino (MO) (top); 8 ng llgl1 ATG MO (middle); 8 ng tp53 + 8ng llgl1 ATG MO (bottom). (D) Localization of Llgl1 immunoreactivity (red puncta) in 32 hpf retina of H2A-GFP (green nuclei) transgenic embryos (left) or those injected with 8 ng tp53 + 8ng llgl1 ATG MO (middle). Localization of fluorescence in 32 hpf retina of wild-type embryos injected with 100 pg GFP-Llgl1 mRNA (right). (E) Sagittal images of eyes in living embryos stained with Acridine Orange (AO) (green puncta, arrows) to label dying cells: 8 ng control+ 8ng tp53 morpholino (MO) (left); 8 ng llgl1 ATG MO (middle); 8 ng tp53 + 8ng llgl1 ATG MO (right). Average number of Acridine Orange-positive cells per eye±s.e.m. (50 μm confocal optic section) (bottom). For each condition, n=10 eyes from 10 embryos were quantified. *P<0.001 (Student’s t-test). (F) Retinal histology of eyes from 80 hpf zebrafish embryos: 8 ng control+ 8ng tp53 morpholino (MO) (left); 8 ng llgl1 ATG MO (middle); 8 ng tp53 + 8ng llgl1 ATG MO (right). (G) Retinal histology of eyes from E15.5 day mice: wild type (left panels) and Llgl1 homozygous mutant (right panels). Note the rosettes in the retinal pigment epithelium (arrow) and neural retina (arrowhead). Scale bars: 250 μm in C; 20 μm in D; 100 μm in E-G.
Fig. 2.
Fig. 2.
Loss of Llgl1 disrupts cell cycle exit in retinal progenitor cells. (A,B) Phosphohistone3 (PH3) immunoreactivity in zebrafish eyes of 36 hpf (A) wild-type and (B) llgl1 MO (8 ng) embryos. (C) Comparison of the number of PH3-positive mitotic cells between control (black bar) and llgl1 morphant (gray bar) zebrafish embryos (n=12 eyes analyzed for each condition). (D) Comparison of the cell cycle period between control (black bar) and llgl1 morphant (gray bar) zebrafish embryos (n=25 cells each from four control MO or five llgl1 MO embryos). (E,F) Retinal sections from 60 hpf wild-type (E) or llgl1 morphant (F) zebrafish showing BrdU labeling starting at 48 hpf. (G) Comparison of the proportion of BrdU-negative (post-mitotic cells) per section between control (black bars) and llgl1 morphant (gray bars) zebrafish embryos (n=10 retina analyzed for each condition). BrdU was injected from 34-46 hpf (left) or from 48-60 hpf (right). (H) BrdU labeling [red (E14.5-E15.5)] and Ki67 (green) immunoreactivity with colocalization (yellow) and high-magnification inset for wild-type and Llgl1 homozygous mutant mice. (I) Comparison between wild-type (black bar) and Llgl1 homozygous mutant mice (gray bar) for the percentage of retinal cells that had exited the cell cycle between E14.5 and E15.5 (proportion of BrdU-positive; Ki67-negative of the total number of BrdU-positive cells). For each genotype, six eyes from three embryos were quantified. For C,D,G,I, error bars represent s.e.m.; P, Student’s t-test; NS, not significant. Scale bars: 100 μm in A,B,H; 50 μm in E,F.
Fig. 3.
Fig. 3.
Apicobasal polarity is maintained in Llgl1-deficient retinal neuroepithelia. (A-C,E-G) Immunostaining for apical junction markers in 36 hpf zebrafish retina: (A,E) rhodamine-phalloidin; (B,F) β-catenin; (C,G) Prkci. For the apical markers, zebrafish were injected with either 8 ng control+ 8ng tp53 MO (A-C) or 8 ng tp53 + 8ng llgl1 ATG MO (E-G). (D,H) Immunostaining for the basal marker syntaxin 4 in wild-type (D) or Lgl1 mutant (H) E15.5 mouse retina. Note the basal staining in a rosette in H (arrowhead). (I,J) Transmission electron micrographs of zebrafish retinal neuroepithelial cells injected with either 8 ng control+ 8ng tp53 MO (I) or 8 ng tp53 + 8ng llgl1 ATG MO (J). The apical membrane above the electron-dense adherens junctions is highlighted (red outline). Individual cells are pseudo-colored green for contrast. (K) Comparison of the average length of apical membrane between control (black bar) and llgl1 morphant (gray bar) cells. Scale bars: 25 μm in A-H; 500 nm in I,J.
Fig. 4.
Fig. 4.
Apical domain expansion in Llgl1-deficient retinal neuroepithelia. (A) Schematic showing the experimental design for evaluating apical domain of morphant retinal neuroepithelia in wild-type host eyes. (B) Confocal image of the apical surface area of retinal neuroepithelial endfeet. Donor cells (green) were derived from embryos injected from either 8 ng control+ 8ng tp53 MO (left) or 8 ng tp53 + 8ng llgl1 ATG MO (right). Chimeric embryos were fixed at 34 hpf and stained for rhodamine-phalloidin (red). (C) Comparison of the apical surface area between control (black bars) and llgl1 morphant (gray bars) cells (n=22 cells each from six control MO or 5 llgl1 MO chimeras). (D) Comparison of the total surface area between control (black bars) and llgl1 morphant (gray bars) cells (n=25 cells each from three control MO or three llgl1 MO retinas). For D and E, error bars represent s.e.m.; P, Student’s t-test; NS, not significant. Scale bar: 10 μm in B.
Fig. 5.
Fig. 5.
Neurogenesis is reduced in Llgl1-deficient retinal neuroepithelia. (A) Experimental design for evaluating neurogenesis in morphant retinal cells in wild-type host eyes. (B) Confocal images of donor cells showing atoh7:GFP (green, left panels), H2A-mCherry (red, middle panels) and combined images (right panels) at 36 hpf. Donor cells were derived from embryos injected with either 8 ng control+ 8ng tp53 MO (top) or 8 ng tp53 + 8ng llgl1 ATG MO (bottom). (C) Comparison of the proportion of atoh7:GFP-positive cells in control or llgl1 morphant clusters (n>10 clusters from 10 chimeras for each condition) tracked at 26, 36 and 60 hpf. Cluster Growth Quotient indicates the fold expansion of the cluster cell number [(60 hpf cell number–26 hpf cell number)/26 hpf cell number]. (D) Image plane used to measure apical area. (E) Confocal images of retinal neuroepithelial apical domains prior to atoh7:GFP expression (segmented areas, left) and just after GFP became detectable (right). Apical junctions are labeled by injection of RFP-UtrCH mRNA (red) (F) Comparison of the apical area of cells prior to atoh7:GFP (green bars, n=21 cells) expression and cells that did not go on to express GFP (black bars, n=35 cells). Error bars represent s.e.m.; P, Student’s t-test.
Fig. 6.
Fig. 6.
Inhibiting Shroom3 expanded the apical domain and reduced neurogenesis in retinal neuroepithelia. (A) Schematic showing modular organization of wild-type vertebrate Shroom3 and the dominant-negative (Shrm3DN) version. (B) Localization of prom1b-GFP in non-transgenic and Shrm3DN transgenic retina following heat shock (HS). (C,D) Transmission electron micrographs of 32 hpf retinal neuroepithelial cells from (C) non-transgenic and (D) Shrm3DN transgenic retina following heat shock. The apical membrane above the electron-dense adherens junctions is highlighted (red outline). Individual cells are pseudo-colored green for contrast. (E) Confocal image (left panel) of the apical retinal surface of 32 hpf prom1b-GFP (green) transgenic embryos injected with shrm3DN:ires:mCherry plasmid (red). Segmentation of the confocal image, used for quantification, is shown in the right panel. (F) Comparison of the apical area between Shrm3DN-positive cells (gray bars, n=20 cells, three embryos) and mCherry-negative cells (black bars, n=20 cells, three embryos). (G) Schematic showing the experimental design for evaluating neurogenesis in Shroom3DN-expressing cells in wild-type host eyes. (H) Comparison of the proportion of atoh7:GFP-positive cells in mCherry-positive clusters with either hsp70:mCherry-(black bars) or hsp70:shrm3DN:ires:mCherry (gray bars)-injected plasmid (for each condition, n=10 clusters, 10 embryos). (I) Examples of clusters expressing either hsp70:mCherry (red, right) or hsp70:shrm3DN:ires:mCherry (red, left) in a atoh7:GFP background (green cells) following heat shock (HS). For F and H, error bars represent s.e.m.; P, Student’s t-test. Scale bars: 500 nm in C,D.
Fig. 7.
Fig. 7.
Augmented Notch signaling is required for reduced neurogenesis with loss of Llgl1. (A,B) Retinal expression of her4:dRed in 36 hpf embryos injected with plasmid DNA for hsp70:Shrm3DN:ires:GFP (A) or hsp70:GFP (B). (C) Pixel intensity measurements comparing her4:dRed expression in hsp70:Shrm3DN:ires:GFP-positive (n=58) and -negative (n=162) or hsp70:GFP-positive (n=72) or -negative (n=138) cells. (D,E) Retinal expression of tp1:d2GFP in 36 hpf embryos injected with plasmid DNA for (D) hsp70:Shrm3DN:ires:mCherry or (E) hsp70:mCherry. (F) Pixel intensity measurements comparing tp1:d2GFP expression in hsp70:Shrm3DN:ires:GFP-positive (n=73) and -negative (n=73) or hsp70:GFP-positive (n=66) or -negative (n=70) cells. Error bars in C and F represent s.e.m.; n equals total number of cells quantified from more than three embryos for each condition; P, Student’s t-test. (G) Percentage of cells within an atoh7:GFP-donor cluster that express GFP at 36 hpf. The morpholino condition is listed under each bar: 8 ng tp53 MO; 8 ng tp53 + 8ng llgl1 ATG MO; 8 ng tp53 + 8ng llgl1 ATG MO + 4 ng rbpj MO; 8 ng tp53 + 4 ng rbpj MO. For each condition, n=12 clusters were scored from 12 chimeras. P, one-way ANOVA following Tukey’s post-hoc test; ns, not significant. (H) Maximum basal nuclear position during interkinetic nuclear migration in retinal donor cells that expressed atoh7:GFP (green) or remained GFP negative (red) from donor embryos injected with either 8 ng control + 8ng tp53 MO (left) or 8 ng tp53 + 8ng llgl1 ATG MO (right). Maximum nuclear position is significantly different for neurogenic progenitors in control versus llgl1 morphants; P, Wilcoxon Rank Sum Test. (I) Schematic model showing neuroepithelial cells undergoing nuclear migration. Wild-type cells with basal nuclei become neurogenic progenitors. In Llgl1-deficient cells, the apical domain (red) is expanded and the apical-associated signals (blue gradient) are increased, causing cells with basal nuclei to divide as proliferative progenitors. (J) Schematic model showing neuroepithelial cells undergoing cytokinesis. Divisions that differentially partition the apical membrane drive asymmetric fates, whereas divisions that equally segregate the apical domain result in symmetric fates. Cells with larger apical domains, such as with Llgl1 deletion, may tend to partition this domain equally.

Similar articles

Cited by

References

    1. Afonso C., Henrique D. (2006). PAR3 acts as a molecular organizer to define the apical domain of chick neuroepithelial cells. J. Cell Sci. 119, 4293–4304 - PubMed
    1. Agathocleous M., Iordanova I., Willardsen M. I., Xue X. Y., Vetter M. L., Harris W. A., Moore K. B. (2009). A directional Wnt/beta-catenin-Sox2-proneural pathway regulates the transition from proliferation to differentiation in the Xenopus retina. Development 136, 3289–3299 - PMC - PubMed
    1. Albertson R., Doe C. Q. (2003). Dlg, Scrib and Lgl regulate neuroblast cell size and mitotic spindle asymmetry. Nat. Cell Biol. 5, 166–170 - PubMed
    1. Alexandre P., Reugels A. M., Barker D., Blanc E., Clarke J. D. (2010). Neurons derive from the more apical daughter in asymmetric divisions in the zebrafish neural tube. Nat. Neurosci. 13, 673–679 - PubMed
    1. Baye L. M., Link B. A. (2007). Interkinetic nuclear migration and the selection of neurogenic cell divisions during vertebrate retinogenesis. J. Neurosci. 27, 10143–10152 - PMC - PubMed

Publication types