

Simple absolute quantification method correcting for quantitative PCR efficiency variations for microbial community samples
- PMID: 22492459
- PMCID: PMC3370567
- DOI: 10.1128/AEM.07878-11
Simple absolute quantification method correcting for quantitative PCR efficiency variations for microbial community samples
Abstract
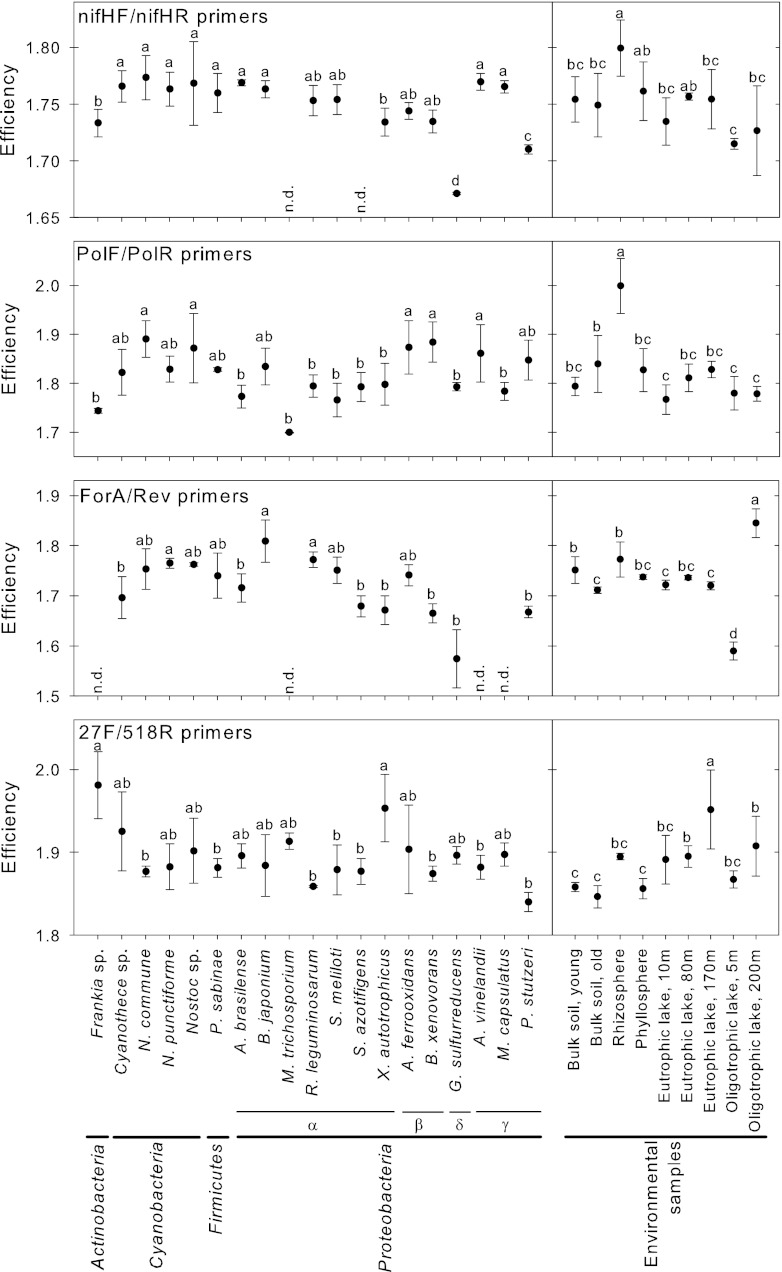
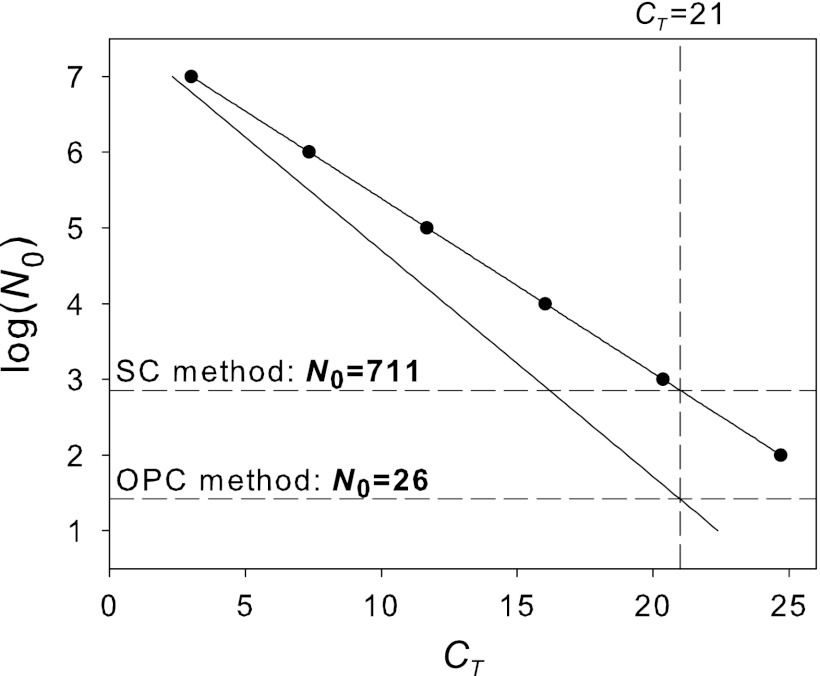
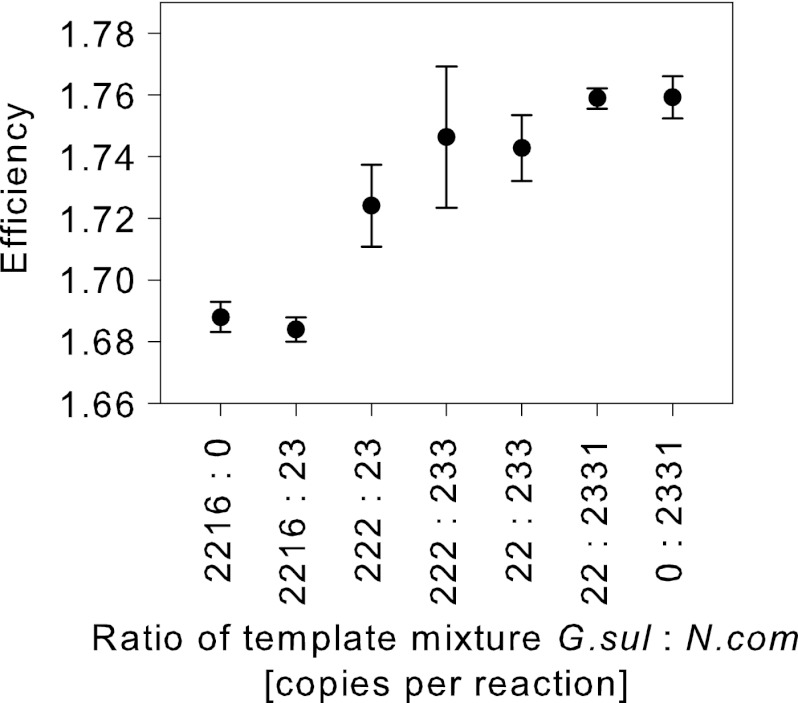
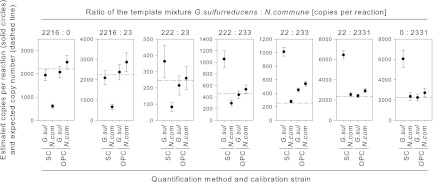
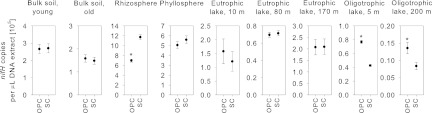
Real-time quantitative PCR (qPCR) is a widely used technique in microbial community analysis, allowing the quantification of the number of target genes in a community sample. Currently, the standard-curve (SC) method of absolute quantification is widely employed for these kinds of analysis. However, the SC method assumes that the amplification efficiency (E) is the same for both the standard and the sample target template. We analyzed 19 bacterial strains and nine environmental samples in qPCR assays, targeting the nifH and 16S rRNA genes. The E values of the qPCRs differed significantly, depending on the template. This has major implications for the quantification. If the sample and standard differ in their E values, quantification errors of up to orders of magnitude are possible. To address this problem, we propose and test the one-point calibration (OPC) method for absolute quantification. The OPC method corrects for differences in E and was derived from the ΔΔC(T) method with correction for E, which is commonly used for relative quantification in gene expression studies. The SC and OPC methods were compared by quantifying artificial template mixtures from Geobacter sulfurreducens (DSM 12127) and Nostoc commune (Culture Collection of Algae and Protozoa [CCAP] 1453/33), which differ in their E values. While the SC method deviated from the expected nifH gene copy number by 3- to 5-fold, the OPC method quantified the template mixtures with high accuracy. Moreover, analyzing environmental samples, we show that even small differences in E between the standard and the sample can cause significant differences between the copy numbers calculated by the SC and the OPC methods.
Figures
References
-
- Bekele AZ, Koike S, Kobayashi Y. 2011. Phylogenetic diversity and dietary association of rumen Treponema revealed using group-specific 16S rRNA gene-based analysis. FEMS Microbiol. Lett. 316:51–60 - PubMed
-
- Burns M, Valdivia H. 2008. Modelling the limit of detection in real-time quantitative PCR. Eur. Food Res. Technol. 226:1513–1524
-
- Bustin SA. 2004. Quantification of nucleic acids by PCR, p 3–48 In Bustin SA. (ed), A-Z of quantitative PCR. IUL biotechnology series, vol 5 International University Line, La Jolla, CA
Publication types
MeSH terms
Substances
LinkOut - more resources
Full Text Sources
Molecular Biology Databases
