. 2012 May 11;110(10):1311-21.
doi: 10.1161/CIRCRESAHA.111.262592. Epub 2012 Apr 5.

Tuning electrical conduction along endothelial tubes of resistance arteries through Ca(2+)-activated K(+) channels

Affiliations

Tuning electrical conduction along endothelial tubes of resistance arteries through Ca(2+)-activated K(+) channels

Erik J Behringer et al. Circ Res. .

Abstract

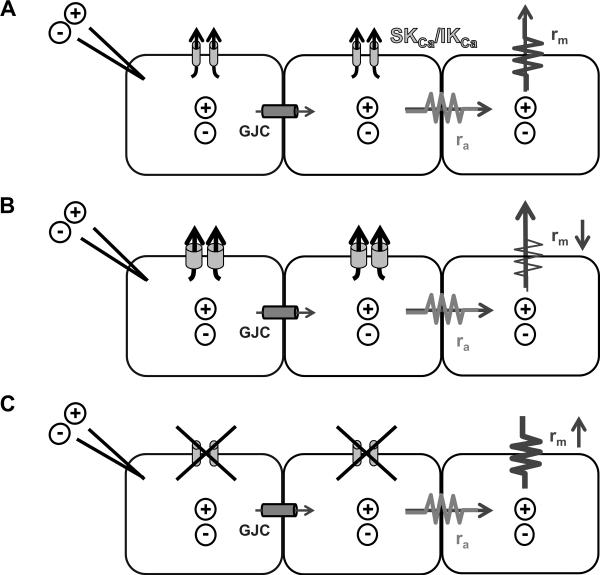
Rationale: Electrical conduction through gap junction channels between endothelial cells of resistance vessels is integral to blood flow control. Small and intermediate-conductance Ca(2+)-activated K(+) channels (SK(Ca)/IK(Ca)) initiate electrical signals in endothelial cells, but it is unknown whether SK(Ca)/IK(Ca) activation alters signal transmission along the endothelium.

Objective: We tested the hypothesis that SK(Ca)/IK(Ca) activity regulates electrical conduction along the endothelium of resistance vessels.

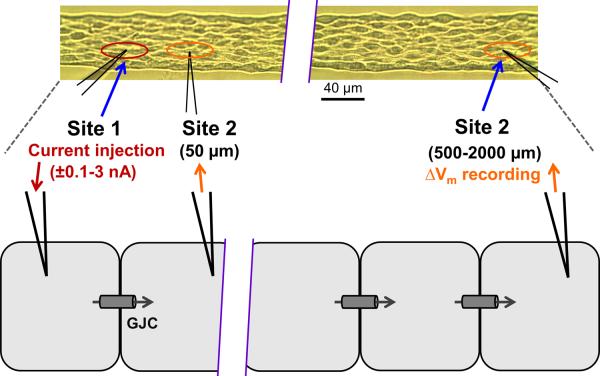
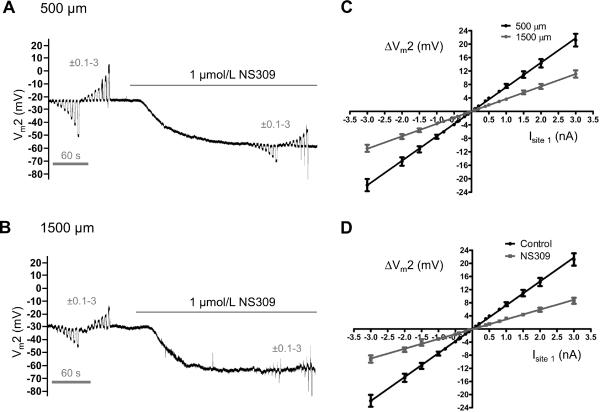
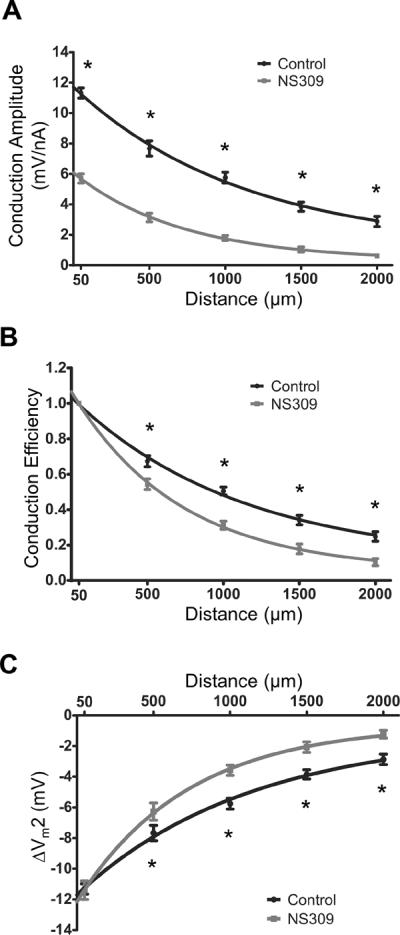
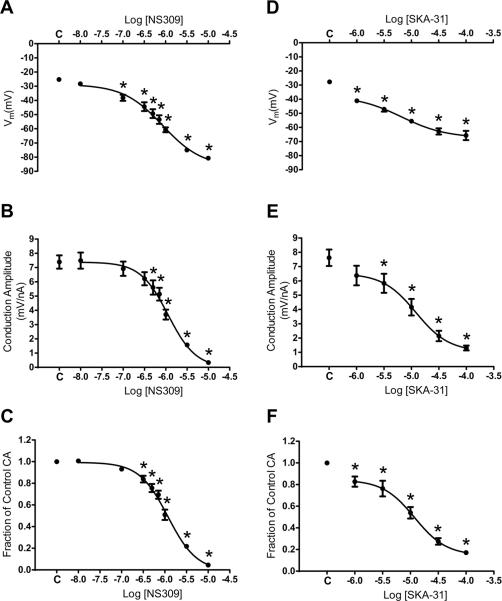
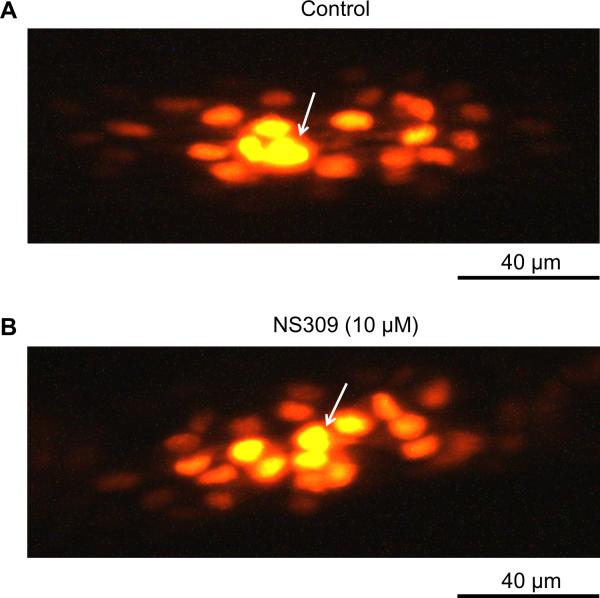
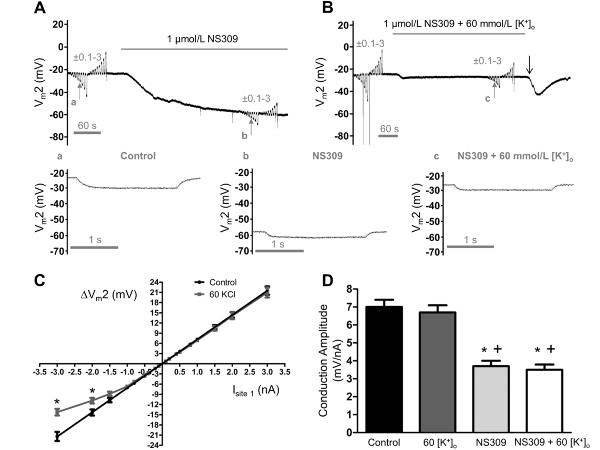
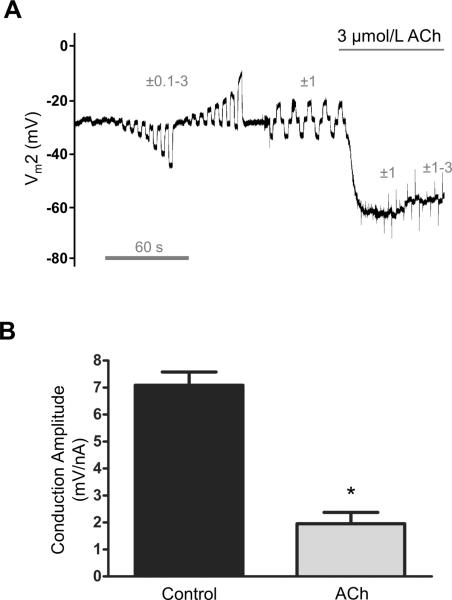
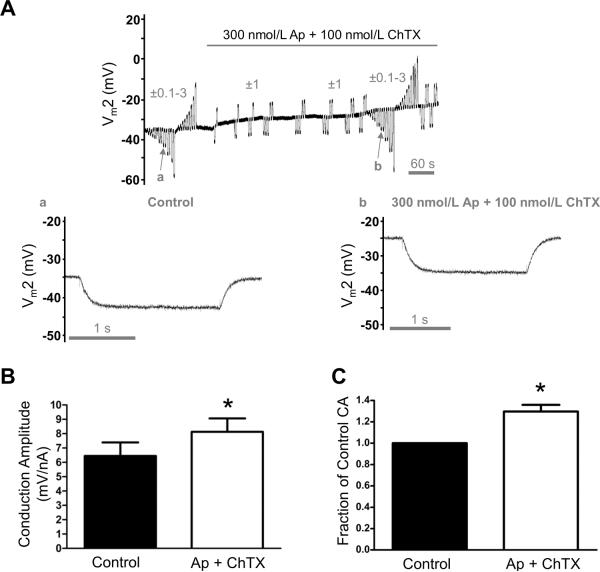
Methods and results: Freshly isolated endothelial cell tubes (60 μm wide; 1-3 mm long; cell length, ≈35 μm) from mouse skeletal muscle feed (superior epigastric) arteries were studied using dual intracellular microelectrodes. Current was injected (±0.1-3 nA) at site 1 while recording membrane potential (V(m)) at site 2 (separation distance=50-2000 μm). SK(Ca)/IK(Ca) activation (NS309, 1 μmol/L) reduced the change in V(m) along endothelial cell tubes by ≥50% and shortened the electrical length constant (λ) from 1380 to 850 μm (P<0.05) while intercellular dye transfer (propidium iodide) was maintained. Activating SK(Ca)/IK(Ca) with acetylcholine or SKA-31 also reduced electrical conduction. These effects of SK(Ca)/IK(Ca) activation persisted when hyperpolarization (>30 mV) was prevented with 60 mmol/L [K(+)](o). Conversely, blocking SK(Ca)/IK(Ca) (apamin+charybdotoxin) depolarized cells by ≈10 mV and enhanced electrical conduction (ie, changes in V(m)) by ≈30% (P<0.05).

Conclusions: These findings illustrate a novel role for SK(Ca)/IK(Ca) activity in tuning electrical conduction along the endothelium of resistance vessels by governing signal dissipation through changes in membrane resistance. Voltage-insensitive ion channels can thereby tune intercellular electrical signaling independent from gap junction channels.


Figures

Figure 1
Figure 1. Experimental design
Inset at top: dual intracellular electrodes positioned in an EC tube (Differential Interference Contrast image). Site 1 and Site 2 shown within ovals correspond to cartoon below. Current (±0.1 – 3.0 nA, 2s pulses) was injected at Site 1 while Vm was recorded with separation distances between microelectrodes of 50–2000 μm. To determine the role of SKCa/IKCa in tuning electrical conduction, SKCa/IKCa on all cells were activated (NS309, SKA-31, ACh) or inhibited (apamin + charybdotoxin) by addition of respective agents to the superfusion solution. With no change in axial resistance (ra) to current flow through gap junction channels (GJC), changes in conduction amplitude (CA; ΔVm at Site 2/current injected at Site 1; mV/nA), reflect changes in membrane resistance (rm) associated with activation or inhibition of SKCa/IKCa. Data in Figs. 3, 4, 6–8 reflect CA responses to −1 nA current injection (note that −ΔVm/−1 nA = positive CA value). The Fraction of Control CA (Figs. 4C, F and 8C) was defined as CA during treatment/CA under control conditions at the same 500 μm site. Conduction Efficiency (Fig. 3B) was defined as (CA at X μm) / (CA at 50 μm), where X= 50–2000 μm.
Figure 2
Figure 2. Effect of distance and SKCa/IKCa activation on electrical conduction
At defined separation distances between intracellular microelectrodes, continuous (paired) recordings at Site 2 during current microinjection at Site 1 were obtained under Control conditions and during NS309 treatment to activate SKCa/IKCa. After each set of paired recordings, washout of NS309 (10–15 min) restored Control Vm before recording at the next distance. A, Representative Vm recording at Site 2 during ±0.1–3 nA microinjected at Site 1 (distance = 500 μm) before and during NS309. From Control Vm of ~−25 mV, NS309 hyperpolarized ECs to ~−60 mV and decreased Vm2 responses. B, As in A with separation distance = 1500 μm. Note reduction in Control Vm2 responses compared to A followed by loss of Vm2 responses during NS309. C, Summary data illustrating the effect of microelectrode separation distance on the change in Vm at Site 2 (ΔVm2) under Control conditions with 500 μm (black line) or 1500 μm (grey line) separation. With reduced slope at greater distance, ΔVm2 responses remained linear through the full range of current injected (R2 = 1). With −1 nA current, absolute ΔVm2 decreased from 7.7 ± 0.6 mV at 500 μm to 3.8 ± 0.3 mV at 1500 μm. D, With separation maintained at 500 μm for the same EC tubes in C, activation of SKCa/IKCa with NS309 (1 μmol/L) reduced CA to 3.1 ± 0.3 mV. Summary data in C and D are means ± S.E.; n = 11. Note: Panels C and D include (with permission: British Journal of Pharmacology © 2011) control data from 8 experiments presented in Figure 2B,C of Behringer et al.
Figure 3
Figure 3. Effect of SKCa/IKCa activation on spatial decay of electrical conduction
Summary data (means ± S.E.) illustrating electrical conduction versus distance between intracellular microelectrodes before and during treatment with NS309 (1 μmol/L). At each distance, continuous (paired) recordings were obtained under Control conditions and during NS309. A, For Conduction Amplitude (−1 nA microinjected at Site 1), NS309 reduced the local response by half and λ by ~40% (Control: 1380±80 μm; NS309: 850±60 μm). B, Conduction Efficiency = data from A normalized to respective values at 50 μm before and during NS309; note greater decay with NS309. C, With current microinjection adjusted to produce the same local ΔVm (Control: −1 nA; NS309: −2 nA), the ΔVm2 (= resting Vm - peak response Vm) with distance indicates greater decay of hyperpolarization with NS309. For these experiments, n = 11 at 50 – 1,500 μm; n=7 at 2,000 μm). *Control significantly different from NS309, P < 0.05 Note: Panel A includes (with permission: British Journal of Pharmacology © 2011) control data from 8 experiments presented in Figure 2B,C of Behringer et al.
Figure 4
Figure 4. Effect of progressive activation of SKCa/IKCa on electrical conduction
Summary data (means ± S.E.) for continuous recordings at Site 2 located 500 μm from current microinjection (−1 nA) at Site 1. A, resting Vm with increasing [NS309]; C indicates Control. B, Conduction Amplitude as a function of [NS309]; C indicates Control. C, As in B indicating effect of SKCa/IKCa activation with NS309 relative to Control (Fraction of Control CA = CA during respective [NS309] / Control CA). D, as in A for SKA-31. E, as in B for SKA-31. F, as in C for SKA-31. *Significantly different from Control, P < 0.05, n = 6–8 in each panel. Note reduced potency and efficacy for SKA-31 versus NS309.
Figure 5
Figure 5. Intercellular dye transfer through GJCs is maintained during SKCa/IKCa activation with NS309
Propidium iodide dye (0.1% in 2M KCl) was included in microelectrode during intracellular recording to evaluate intercellular coupling through gap junction channels. Arrows indicate impaled cell in each panel and recordings lasted 30 min. A, Dye transfer during Control conditions. B, As in A with NS309 (10 μmol/L) introduced 5 min prior to cell penetration. With 500 μm separation between microelectrodes, cells hyperpolarized to −81 ± 1 mV and electrical conduction was abolished (Figs. 4A–4C) yet robust dye transfer to surrounding cells was maintained. Images are representative of n=3 experiments.
Figure 6
Figure 6. Impaired electrical conduction during SKCa/IKCa activation is independent of hyperpolarization
Continuous (paired) recordings of Vm at Site 2 (Vm2) located 500 μm from current microinjections at Site 1. A, Vm2 during ±0.1–3 nA before and during SKCa/IKCa activation with NS309 (1 μmol/L). During NS309, note hyperpolarization (to ~−60 mV) and decrease in Vm2 responses. B, As in A before and during treatment with NS309 + 60 mmol/L [K+]o to prevent hyperpolarization to NS309. Note decrease in Vm2 responses during NS309 similar to findings in A. Transient hyperpolarization near end of recording (“↓”) attributable to slower washout of NS309 versus KCl. a, b and c correspond to small vertical arrows in A and B showing individual recordings of Vm2 during −1 nA injected at Site 1 for (a) control (ΔVm = −6 mV), (b) NS309 (ΔVm = −3 mV), and (c) NS309 + 60 mmol/L [K+]o (ΔVm = −3 mV; note lack of hyperpolarization to NS309 with reduced hyperpolarization to −1 nA current). C, Summary data for ΔVm2 responses to full range of current injection (± 0.1–3 nA) during Control and during 60 mmol/L [K+]o. Note deviation from linearity for ΔV 2 responses to >−1.5 nA during 60 mmol/L [K+]o. *Significantly different from Control, P < 0.05. D, Summary data (means ± S.E.) for CA at Site 2 to −1 nA current injection at Site 1 during Control, during 60 mmol/L [K+]o, during NS309 (1 μmol/L), and during NS309 (1 μmol/L) + 60 mmol/L [K+]o. *Significantly different from Control (P < 0.05). +Significantly different from 60 mmol/L [K+]o, P < 0.05. Summary data (means ± S.E.) in C and D are for n = 7.
Figure 7
Figure 7. Acetylcholine impairs electrical conduction
Data are from continuous (paired) recordings of Vm at Site 2 located 500 μm from current microinjection (−1 nA). A, Representative recording illustrating responses to ±0.1–3 nA before and to ±1, 2, and 3 nA during ACh (3 μmol/L). The Vm during ACh was −67 ± 5 mV (n=6). B, Summary data (means ± S.E.; n=6) for Conduction Amplitude (CA). Note decrease in CA during ACh. Hyperpolarization to −2 nA during ACh (−3.9 ± 0.8 mV, n=6) was significantly less (P < 0.05) than hyperpolarization to −1 nA under Control conditions (−7.1 ± 0.5 mV, n=6). *Significantly different from Control, P < 0.05. Following washout of ACh, CA returned to 7.2 ± 0.5 mV/nA (n=6).
Figure 8
Figure 8. Enhanced electrical conduction during SKCa/IKCa blockade
All data are from continuous (paired) recordings 500 μm from the site of current microinjection. A, Representative recording indicating Vm2 responses to ±0.1–3 nA microinjections before and during SKCa/IKCa block with Ap (300 nmol/L) + ChTX (100 nmol/L). Note depolarization (~10 mV) and increases in Vm2 responses during Ap + ChTX. a and b correspond to arrows in A and illustrate Vm2 responses to −1 nA injected at Site 1 during Control and subsequent exposure to Ap + ChTX: ΔVm2 was −8 mV in a and −10 mV in b. Records are from EC tube with resting Vm = −34 mV to illustrate depolarization and increased CA associated with blocking SKCa/IKCa. B, Summary data (means ± S.E.) for Control and with Ap + ChTX. C, Data from B expressed as Fraction of Control Conduction Amplitude (= CA during Ap + ChTX /Control CA) to illustrate relative effect of SKCa/IKCa inhibition. *Significantly different from Control, P < 0.05 (n = 6).
Figure 9
Figure 9. Role for SKCa/IKCa in tuning electrical conduction along EC tubes
Cartoon illustrating biophysical determinants of electrical signaling along neighboring cells in an EC tube. A, Electrical current (+/-) microinjected into one cell spreads to neighboring cells through gap junction channels (GJC). B, Activation of SKCa/IKCa (e.g., with NS309, SKA-31 or ACh; Figs. 3, 4, 7) increases current leak through the plasma membrane (i.e., rm decreases), thus less current is available to spread to neighboring cells through GJC. C, Blocking SKCa/IKCa (e.g., with apamin + charybdotoxin; Fig. 8) reduces current leak across the plasma membrane (i.e., rm increases) thus more current is available to spread to neighboring cells through GJC. Axial resistance to current flow between cells through GJC (ra) is assumed to remain constant. With respective agents superfused over the entire EC tube, SKCa/IKCa channels were either opened (e.g. via NS309; B) or closed (Ap + ChTX; C) along the entire EC tube.

References

    1. Beny JL. Information networks in the arterial wall. News Physiol Sci. 1999;14:68–73. - PubMed
    1. Schmidt VJ, Wolfle SE, Boettcher M, de Wit C. Gap junctions synchronize vascular tone within the microcirculation. Pharmacol Rep. 2008;60:68–74. - PubMed
    1. Bagher P, Segal SS. Regulation of blood flow in the microcirculation: Role of conducted vasodilation. Acta Physiol (Oxf) 2011;202:271–284. - PMC - PubMed
    1. Emerson GG, Segal SS. Endothelial cell pathway for conduction of hyperpolarization and vasodilation along hamster feed artery. Circ Res. 2000;86:94–100. - PubMed
    1. Looft-Wilson RC, Payne GW, Segal S. Connexin expression and conducted vasodilation along arteriolar endothelium in mouse skeletal muscle. J Appl Physiol. 2004;97:1152–1158. - PubMed

Publication types

MeSH terms