. 2012 Aug;40(14):6401-13.
doi: 10.1093/nar/gks290. Epub 2012 Apr 9.

An analysis of substitution, deletion and insertion mutations in cancer genes

Affiliations

An analysis of substitution, deletion and insertion mutations in cancer genes

Prathima Iengar. Nucleic Acids Res. 2012 Aug.

Abstract

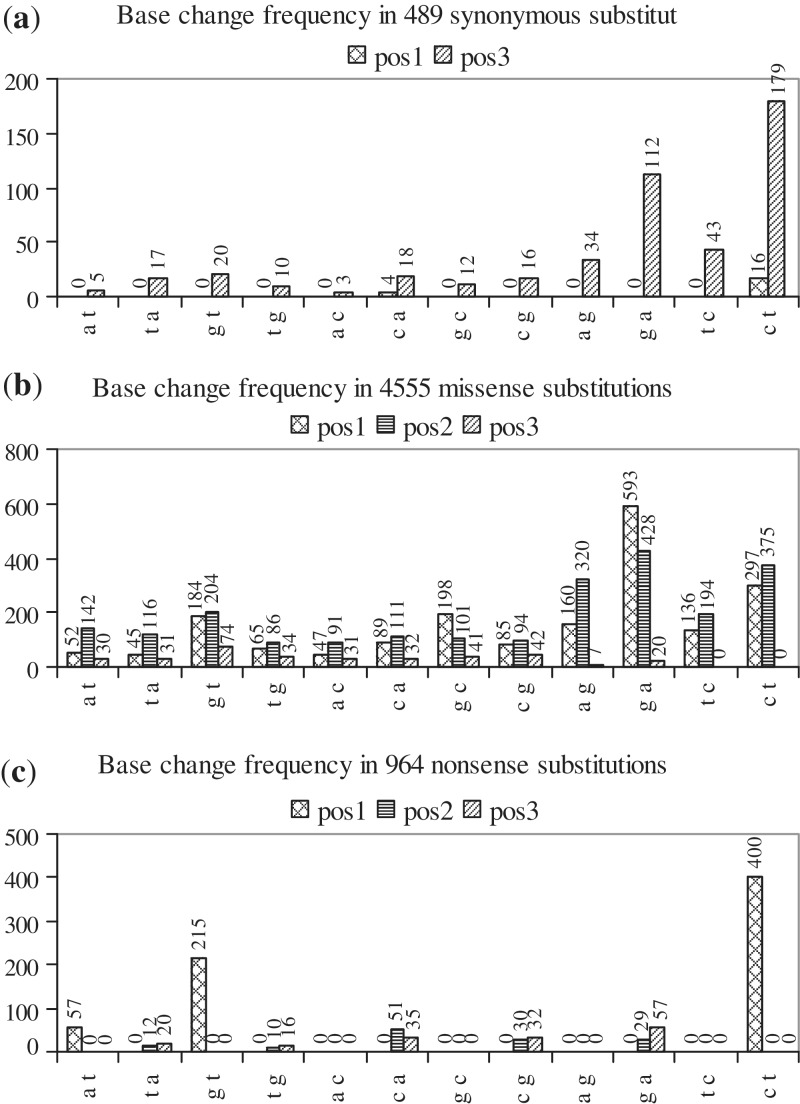
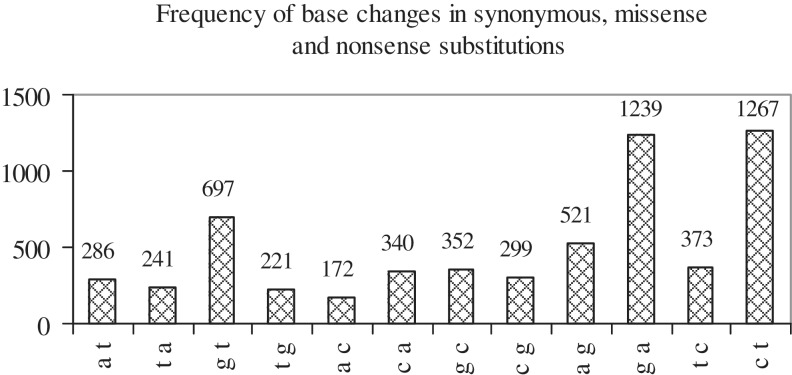
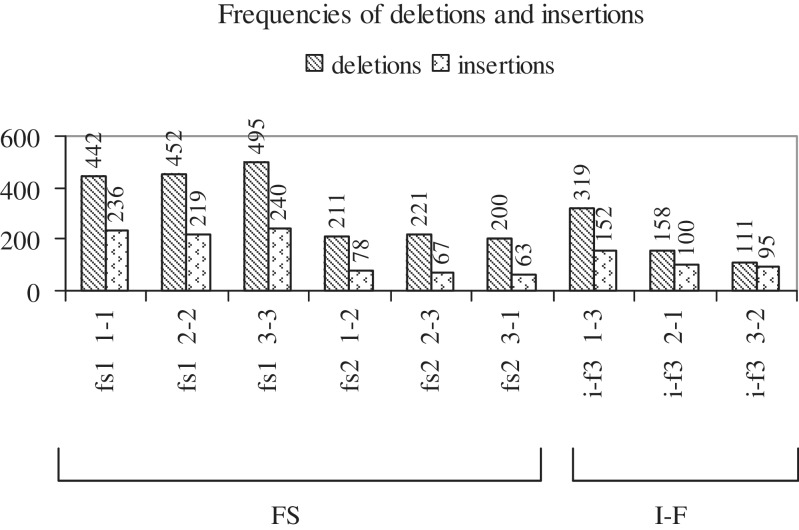
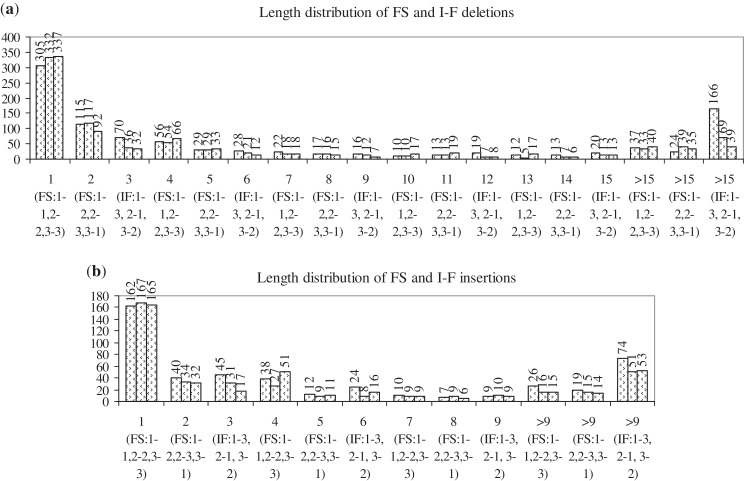
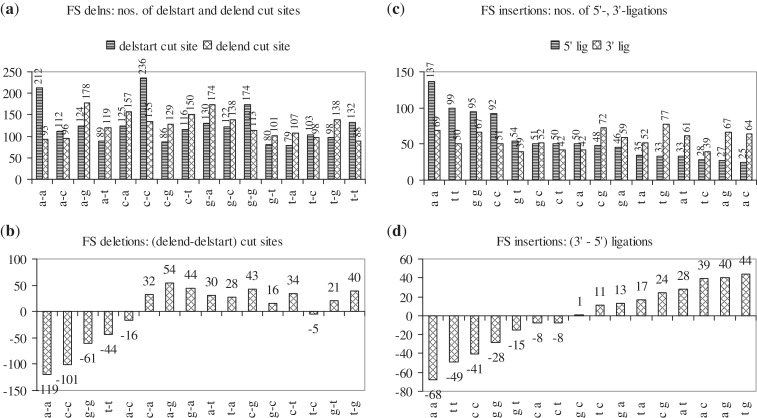
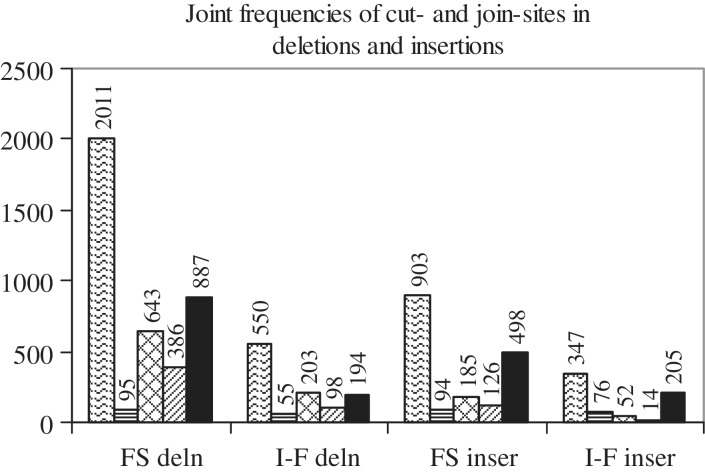
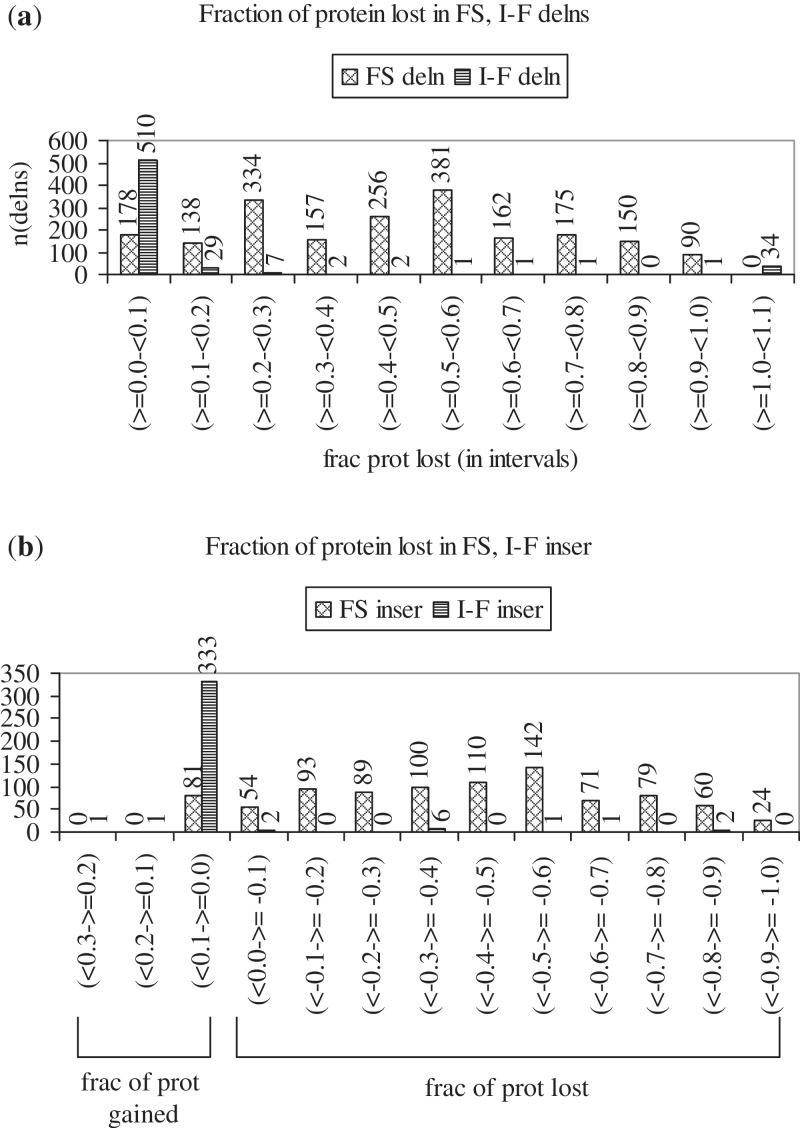
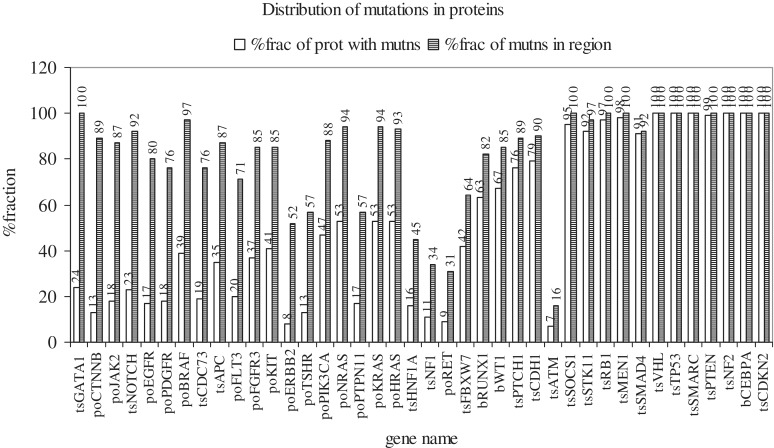
Cancer-associated mutations in cancer genes constitute a diverse set of mutations associated with the disease. To gain insight into features of the set, substitution, deletion and insertion mutations were analysed at the nucleotide level, from the COSMIC database. The most frequent substitutions were c → t, g → a, g → t, and the most frequent codon changes were to termination codons. Deletions more than insertions, FS (frameshift) indels more than I-F (in-frame) ones, and single-nucleotide indels, were frequent. FS indels cause loss of significant fractions of proteins. The 5'-cut in FS deletions, and 5'-ligation in FS insertions, often occur between pairs of identical bases. Interestingly, the cut-site and 3'-ligation in insertions, and 3'-cut and join-pair in deletions, were each found to be the same significantly often (p < 0.001). It is suggested that these features aid the incorporation of indel mutations. Tumor suppressors undergo larger numbers of mutations, especially disruptive ones, over the entire protein length, to inactivate two alleles. Proto-oncogenes undergo fewer, less-disruptive mutations, in selected protein regions, to activate a single allele. Finally, catalogues, in ranked order, of genes mutated in each cancer, and cancers in which each gene is mutated, were created. The study highlights the nucleotide level preferences and disruptive nature of cancer mutations.


Figures

Figure 1.
Figure 1.
Histograms showing the frequency of occurrence of each of the 12 possible base changes at pos1, pos2 and pos3 of codons in: (a) synonymous (b) missense and (c) nonsense substitutions. In each histogram, base changes are indicated along the x-axis, the number of times that each base change is observed (frequency) is indicated along the y-axis and the frequencies of base changes at pos1, pos2 and pos3 of codons are shown as separate series.
Figure 2.
Figure 2.
Histogram showing the frequency of occurrence of each of the 12 possible base changes when all substitution mutations (synonymous, missense, nonsense), occurring at pos1, pos2 and pos3 of codons, are considered. Base changes are indicated along the x-axis and their frequencies are indicated along the y-axis.
Figure 3.
Figure 3.
Histogram showing the frequency of occurrence of each type of FS and I-F deletion and insertion (for nomenclature, see Supplementary Figure S3). The first series shows the frequency distribution for deletions, the second for insertions.
Figure 4.
Figure 4.
Length distributions of the different types of FS and I-F: (a) deletions and (b) insertions. The lengths of indels (in nt) and their frequency of occurrence are given along the x- and y-axes, respectively. The three series, for each length, give the frequencies of the three types of deletions or insertions specified along the x-axis; for example, deletions of length 1 nt result due to FS deletions of types 1-1, 2-2, 3-3, whose frequencies, respectively, are 305, 332, 337. The first three bars give the frequencies of 1-1, 2-2, 3-3 type FS indels (1 nt), the next three give the frequencies of 1-2, 2-3, 3-1 type FS indels (2 nt) and the next three give the frequencies of 1-3, 2-1, 3-2 type I-F indels (3 nt). The cycle then repeats, with the next three bars again giving the frequencies of 1-1, 2-2, 3-3 type FS indels (4 nt), and so on.
Figure 5.
Figure 5.
Histograms showing the frequency with which each of 16 pairs of adjacent nt are cut at the start and end of FS deletions (a and b), and occur as 5′- and 3′-ligations in FS insertions (c and d). In (a), the two series show the frequencies with which each nt pair (e.g. a-a) is cut at the start and end of FS deletions [212, 93]; the difference between the two frequencies for each nt pair [119] is given in (b). In (c), the two series show the frequencies with which each nt pair (e.g. a-a) forms 5′- and 3′-ligations in FS insertions [137, 69]; the difference between the two frequencies for each nt pair [68] is given in (d).
Figure 6.
Figure 6.
Joint frequencies of cut- and join-sites in deletions and insertions. There are four groups of bars; the first two are for FS and I-F deletions, the last two for FS and I-F insertions. The first bar in each group gives the total number of mutations (FS or I-F deletions or insertions) that have cut- and join-sites. In the first two groups of bars (FS and I-F deletions), the second, third, fourth and fifth bars, respectively, give the number of times that: (i) start-cut, end-cut, join-pair are same, (ii) start-cut, end-cut, join-pair are different, (iii) only start-cut, join-pair are same and (iv) only end-cut, join-pair are same. In the last two groups of bars (FS and I-F insertions), the second, third, fourth and fifth bars, respectively, give the number of times that: (i) cut-site, 5′-ligation, 3′-ligation are same, (ii) cut-site, 5′-ligation, 3′-ligation are different, (iii) only cut-site, 5′-ligation are same and (iv) only cut-site, 3′-ligation are same.
Figure 7.
Figure 7.
(a) Histogram showing the fractions of protein lost as a result of FS [2021] and I-F [588] deletions (first and second series). Fractions are given as intervals along the x-axis, and the number of deletions occurring in each interval is given along the y-axis. The fraction of protein lost due to each deletion was calculated as: (number of codons lost)/(number of codons in WT protein). The fraction was <0.1 for 87% (510/588) of I-F deletions, and ≥0.1 for 91% [(2021−178 = 1843)/2021), ≥0.2 for 84% (1705/2021) and ≥0.4 for 60% of FS deletions. (b) Histogram showing the fractions of protein gained or lost as a result of FS [903] and I-F [347] insertions (first and second series). Fractions are given as intervals along the x-axis (range, 0.3 through −1.0). Fractions >0 indicate increase, and <0 indicate decrease in protein length. The number of observations in each interval is given along the y-axis. The fraction of protein gained or lost due to each insertion was calculated as: (number of codons in mutant protein–number of codons in WT protein)/(number of codons in WT protein). Nearly 96% (333/347) of I-F insertions caused increase, and 91% [(903−81 = 822)/903] of FS insertions caused decrease in protein length.
Figure 8.
Figure 8.
Distribution of mutation positions over the lengths of proteins. Genes [40] are listed along the x-axis and each gene name is prefixed by po, ts or b, which indicate, respectively, whether the gene functions as a PO, a TS or as both. For each gene, there is a pair of bars which are related to each other. The %fraction of the protein given in the first bar contains the %fraction of mutation positions given in the second bar [Supplementary Methods (ii)]. For example, in the PO, CTNNB1, 89% of all mutation positions (second bar) occur in 13% of the protein length (first bar). A tall second bar and a short first bar indicate that the majority of mutations occur in a small segment of the protein; first and second bars of nearly equal length indicate that the mutations occur over the entire length of the protein.

Similar articles

Cited by

References

    1. Stehelin D, Varmus HE, Bishop JM, Vogt PK. DNA related to the transforming gene(s) of avian sarcoma viruses is present in normal avian DNA. Nature. 1976;260:170–173. - PubMed
    1. Tabin CJ, Bradley SM, Bargmann CI, Weinberg RA, Papageorge AG, Scolnick EM, Dhar R, Lowy DR, Chang EH. Mechanism of activation of a human oncogene. Nature. 1982;300:143–9. - PubMed
    1. Harris H, Miller OJ, Klein G, Worst P, Tachibana T. Suppression of malignancy by cell fusion. Nature. 1969;223:363–368. - PubMed
    1. Knudson AG. Mutation and cancer: statistical study of retinoblastoma. Proc. Natl Acad. Sci. USA. 1971;68:820–823. - PMC - PubMed
    1. Weinberg RA. Tumor suppressor genes. Science. 1991;254:1138–46. - PubMed

Publication types