

Metacognition in human decision-making: confidence and error monitoring
- PMID: 22492749
- PMCID: PMC3318764
- DOI: 10.1098/rstb.2011.0416
Metacognition in human decision-making: confidence and error monitoring
Abstract
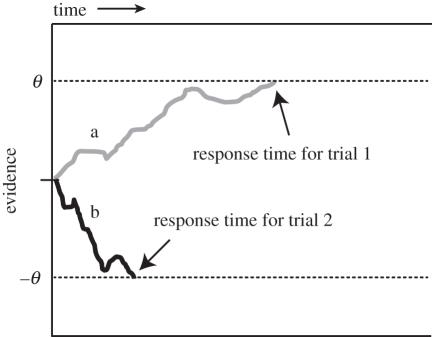
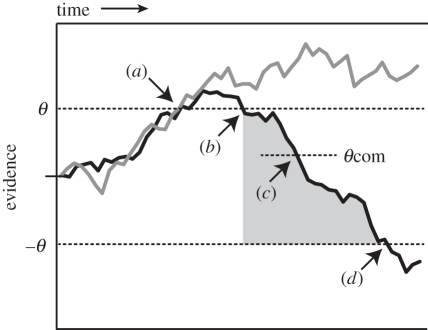
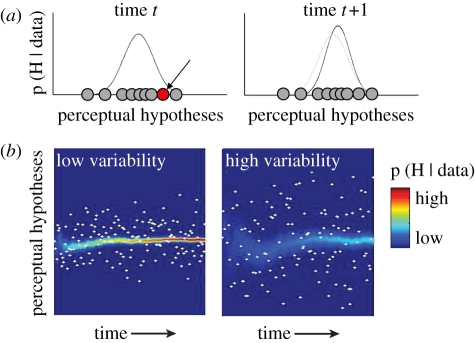
People are capable of robust evaluations of their decisions: they are often aware of their mistakes even without explicit feedback, and report levels of confidence in their decisions that correlate with objective performance. These metacognitive abilities help people to avoid making the same mistakes twice, and to avoid overcommitting time or resources to decisions that are based on unreliable evidence. In this review, we consider progress in characterizing the neural and mechanistic basis of these related aspects of metacognition-confidence judgements and error monitoring-and identify crucial points of convergence between methods and theories in the two fields. This convergence suggests that common principles govern metacognitive judgements of confidence and accuracy; in particular, a shared reliance on post-decisional processing within the systems responsible for the initial decision. However, research in both fields has focused rather narrowly on simple, discrete decisions-reflecting the correspondingly restricted focus of current models of the decision process itself-raising doubts about the degree to which discovered principles will scale up to explain metacognitive evaluation of real-world decisions and actions that are fluid, temporally extended, and embedded in the broader context of evolving behavioural goals.
Figures
References
-
- Gold J. I., Shadlen M. N. 2007. The neural basis of decision making. Annu. Rev. Neurosci. 30, 535–574 10.1146/annurev.neuro.29.051605.113038 (doi:10.1146/annurev.neuro.29.051605.113038) - DOI - PubMed
-
- Bogacz R., Brown E., Moehlis J., Holmes P., Cohen J. D. 2006. The physics of optimal decision making: a formal analysis of models of performance in two-alternative forced-choice tasks. Psychol. Rev. 113, 700–765 10.1037/0033-295X.113.4.700 (doi:10.1037/0033-295X.113.4.700) - DOI - PubMed
-
- Ratcliff R., McKoon G. 2008. The diffusion decision model: theory and data for two-choice decision tasks. Neural Comput. 20, 873–922 10.1162/neco.2008.12-06-420 (doi:10.1162/neco.2008.12-06-420) - DOI - PMC - PubMed
-
- Smith P. L., Ratcliff R. 2004. Psychology and neurobiology of simple decisions. Trends Neurosci. 27, 161–168 10.1016/j.tins.2004.01.006 (doi:10.1016/j.tins.2004.01.006) - DOI - PubMed
-
- Wald A., Wolfowitz J. 1949. Bayes solutions of sequential decision problems. Proc. Natl Acad. Sci. USA 35, 99–102 10.1073/pnas.35.2.99 (doi:10.1073/pnas.35.2.99) - DOI - PMC - PubMed
Publication types
MeSH terms
Grants and funding
LinkOut - more resources
Full Text Sources
Other Literature Sources
Medical