. 2012 Apr;24(4):1675-90.
doi: 10.1105/tpc.112.095869. Epub 2012 Apr 6.

Requirement of the cytosolic interaction between PATHOGENESIS-RELATED PROTEIN10 and LEUCINE-RICH REPEAT PROTEIN1 for cell death and defense signaling in pepper

Affiliations

Requirement of the cytosolic interaction between PATHOGENESIS-RELATED PROTEIN10 and LEUCINE-RICH REPEAT PROTEIN1 for cell death and defense signaling in pepper

Du Seok Choi et al. Plant Cell. 2012 Apr.

Abstract

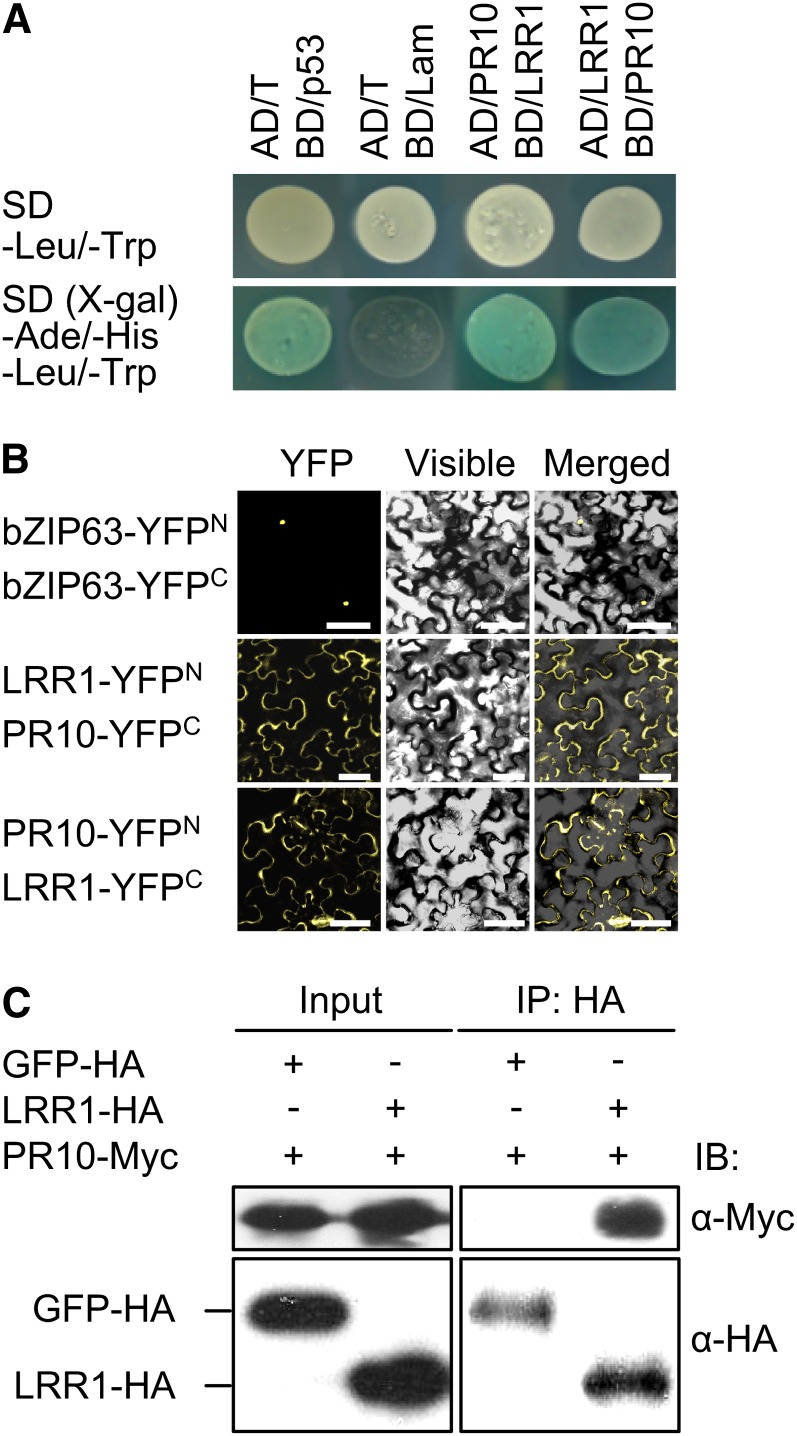
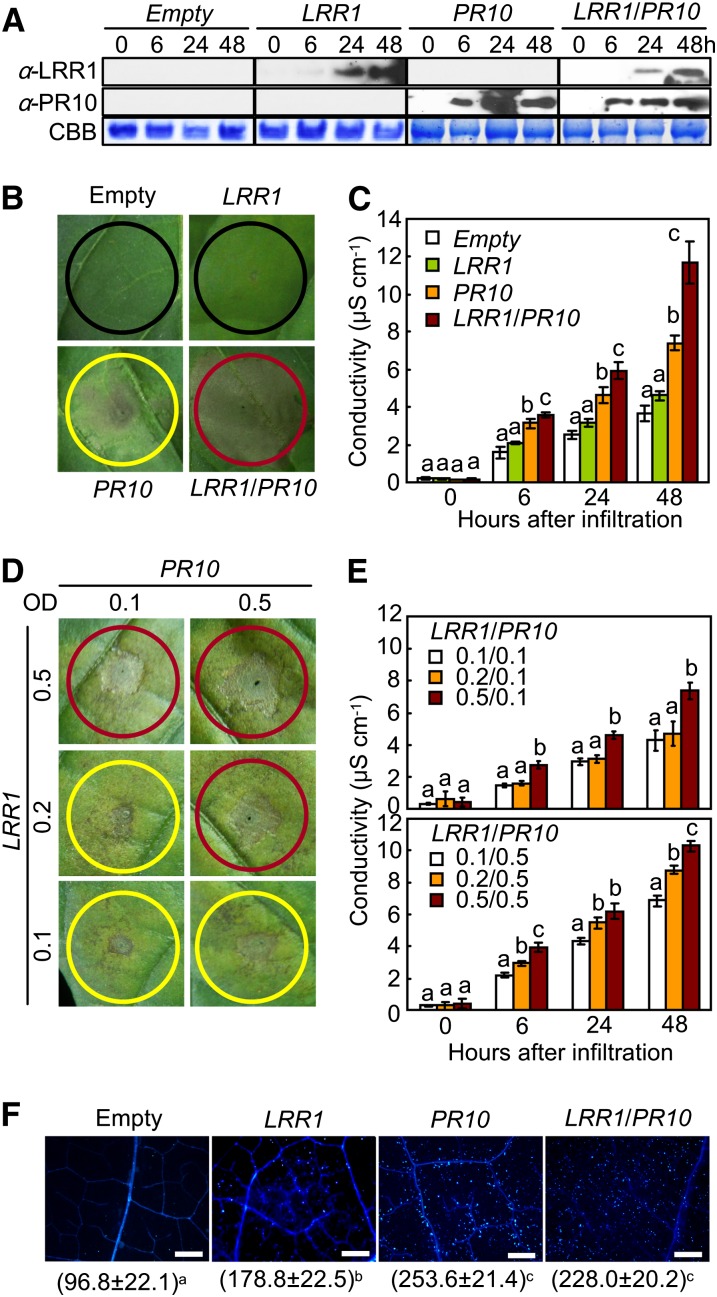
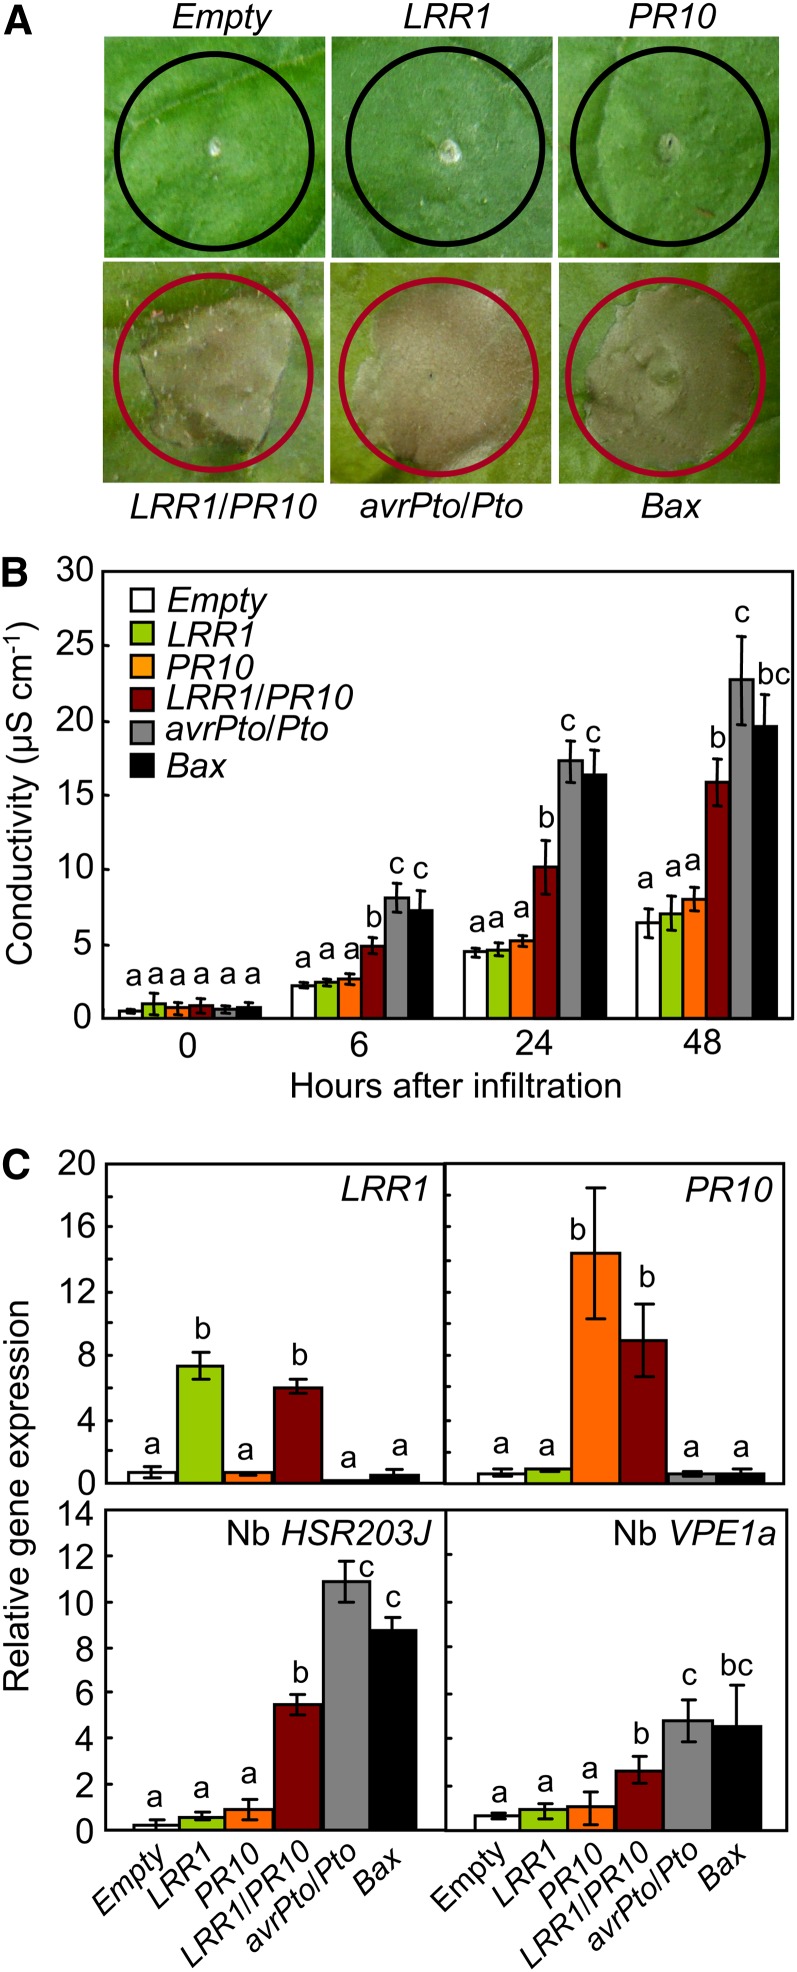
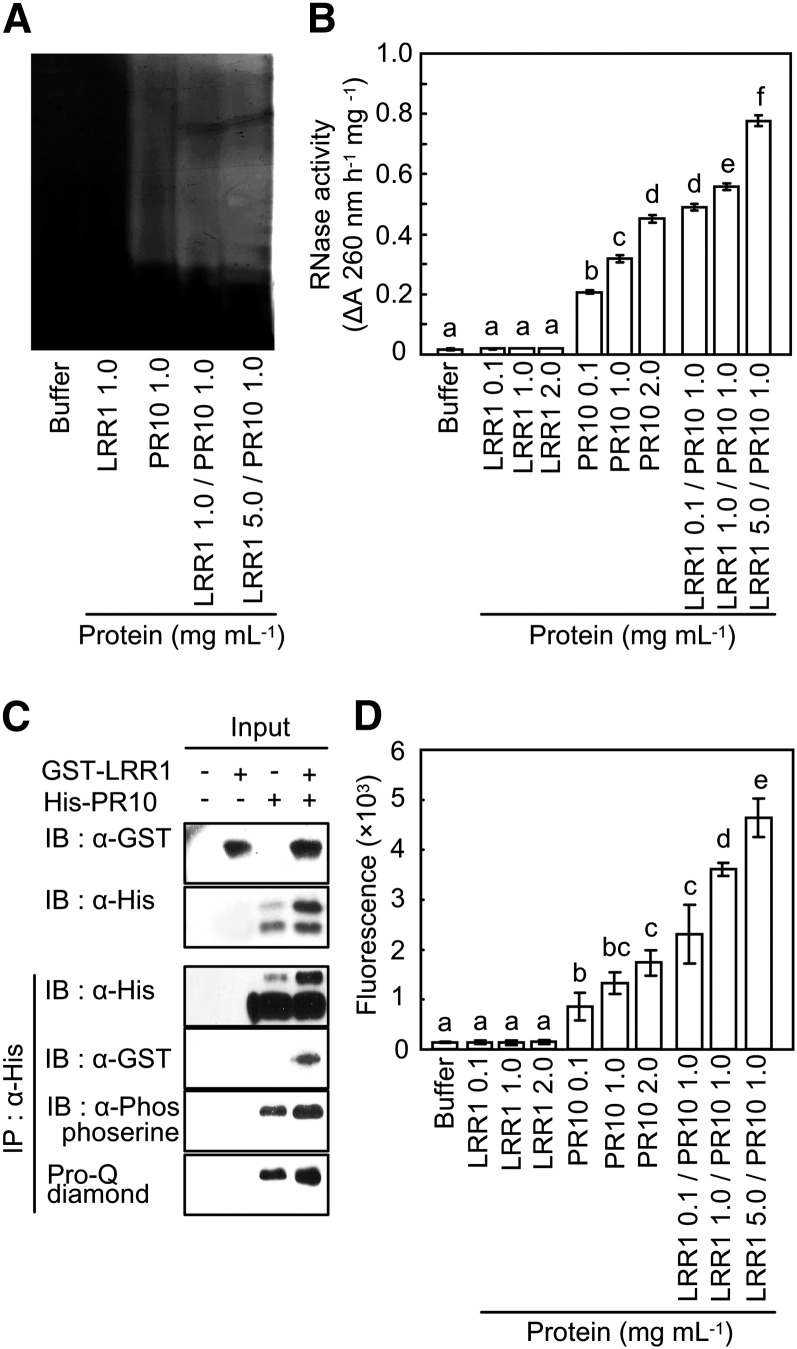
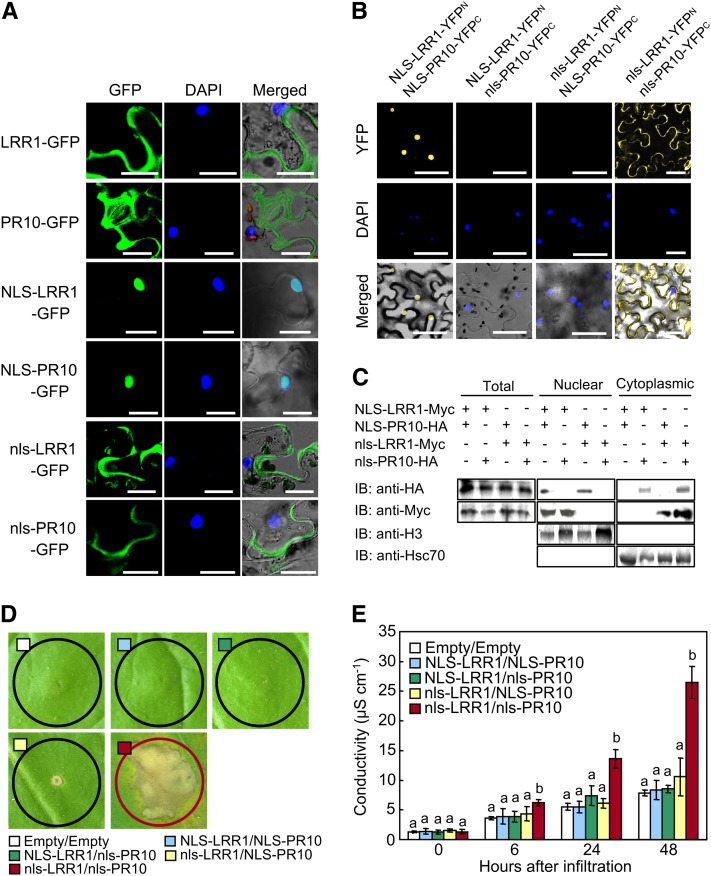
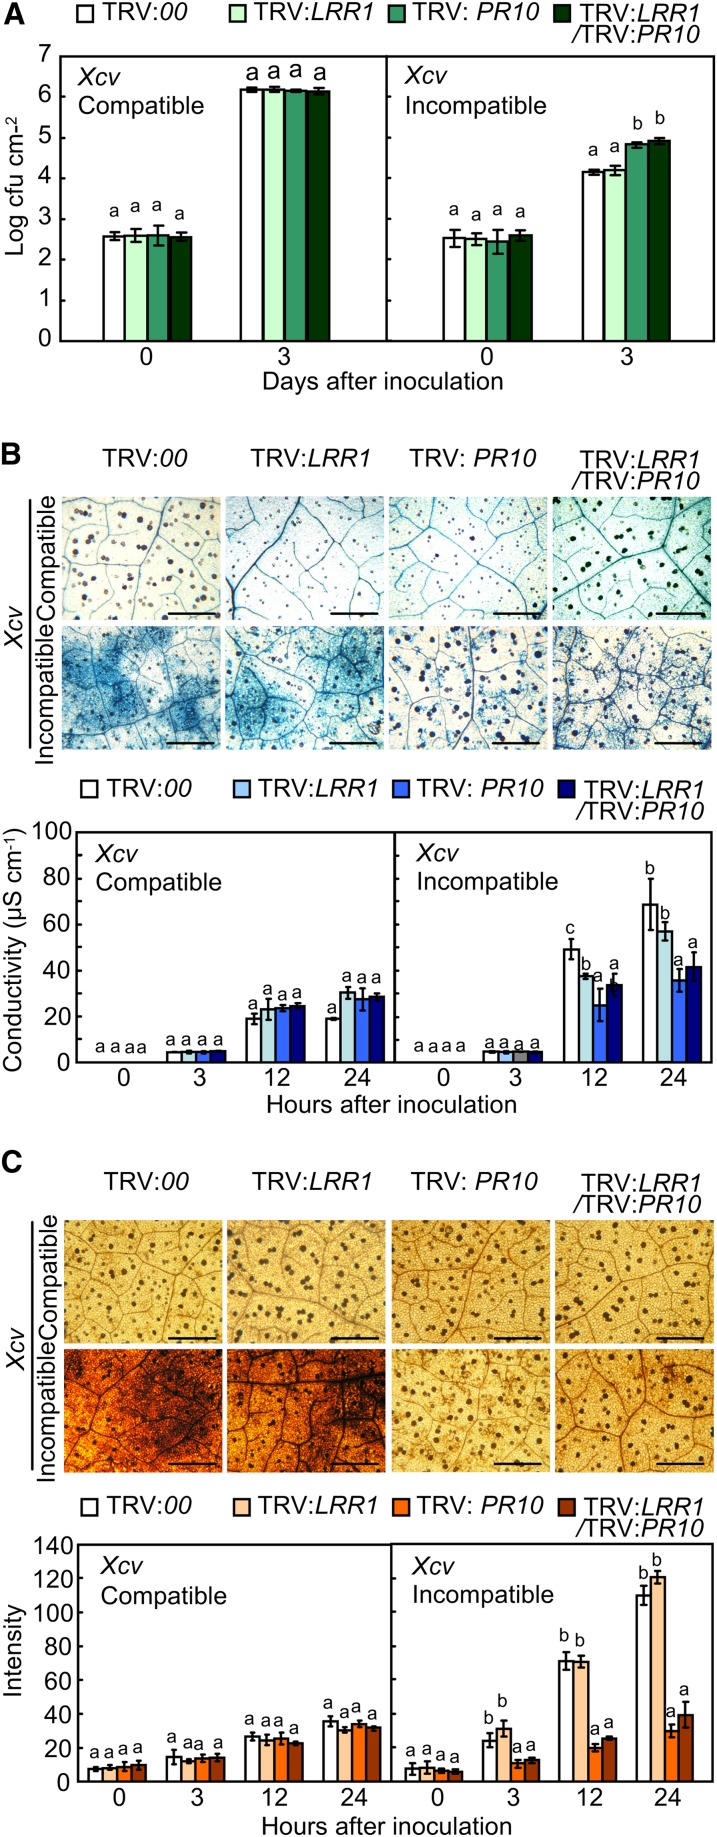
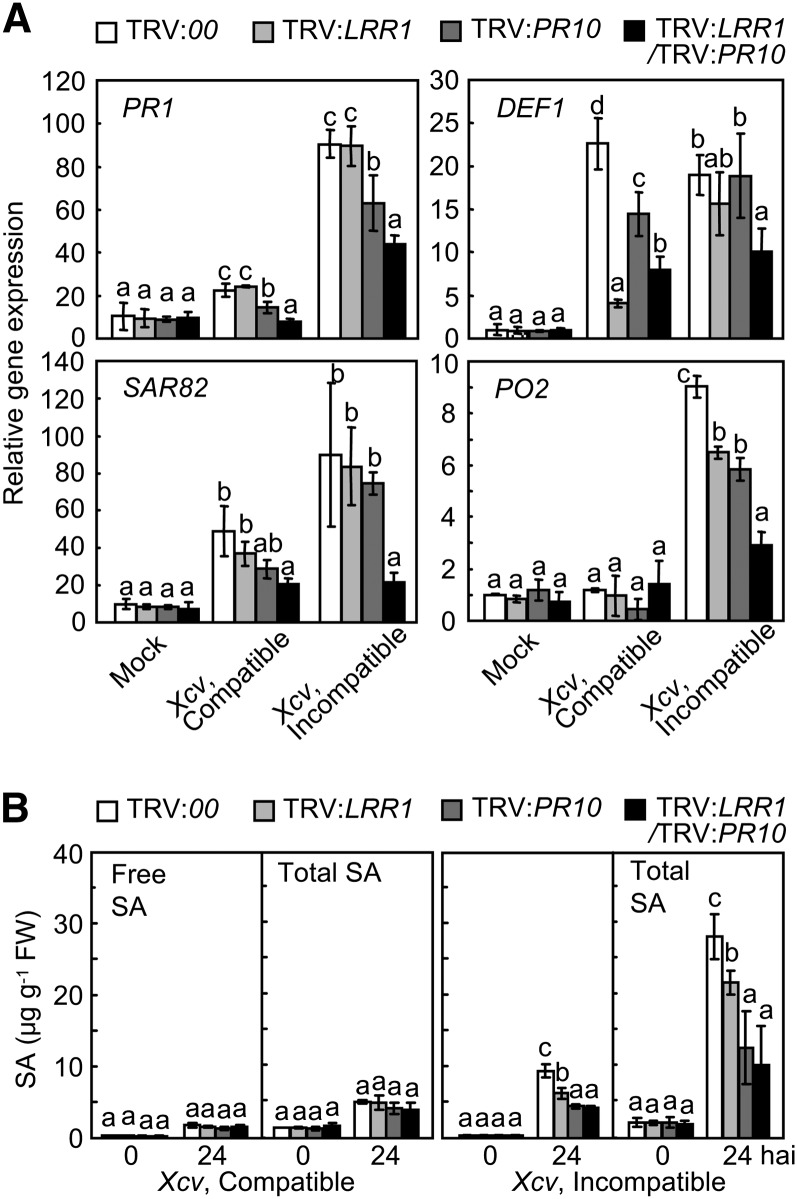
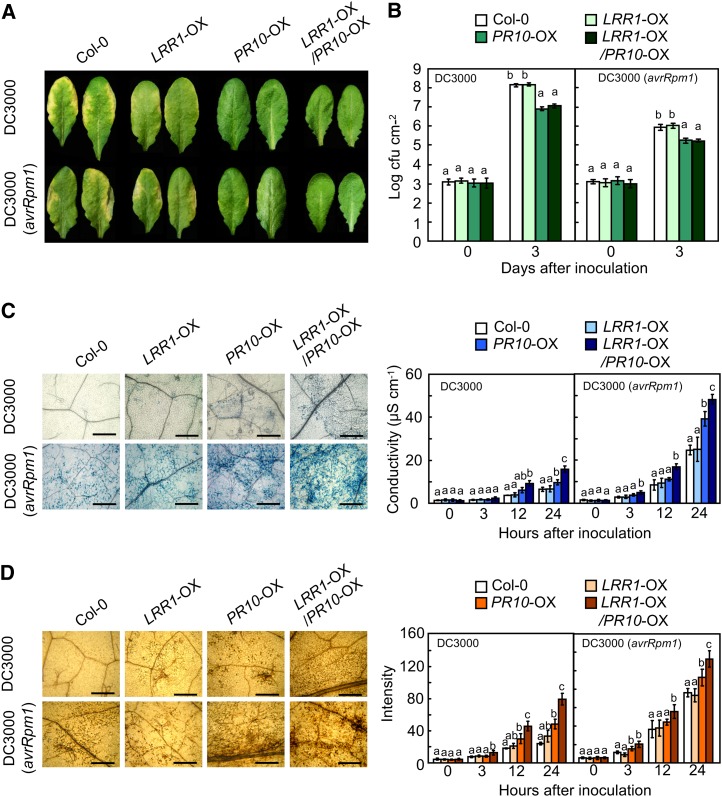
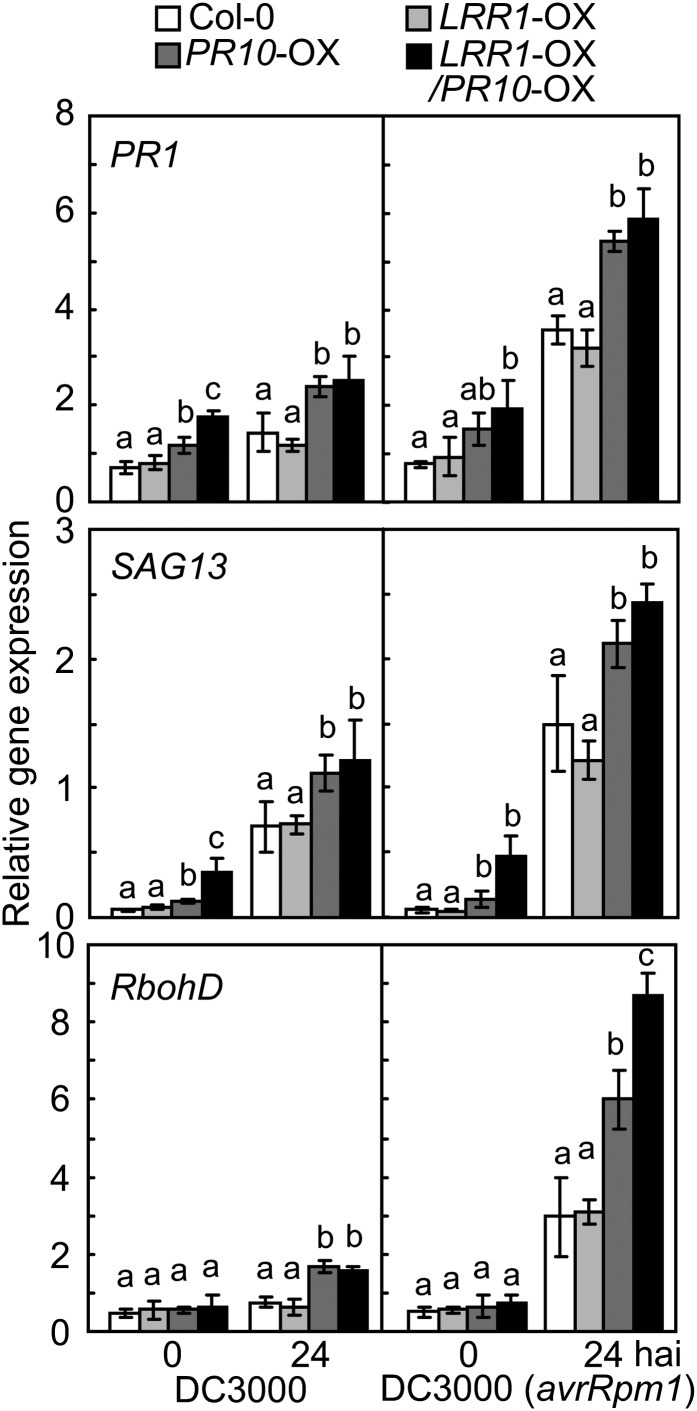
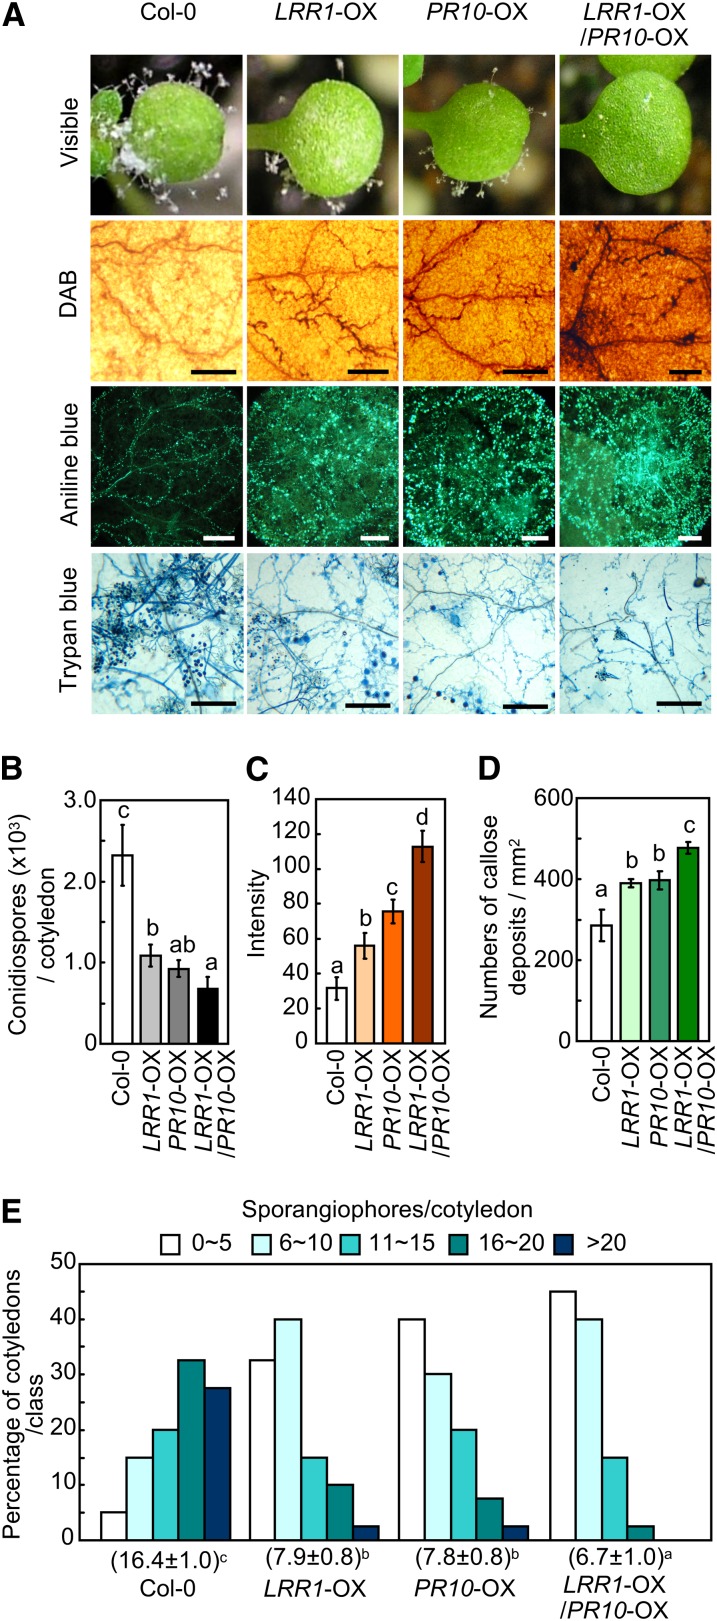
Plants recruit innate immune receptors such as leucine-rich repeat (LRR) proteins to recognize pathogen attack and activate defense genes. Here, we identified the pepper (Capsicum annuum) pathogenesis-related protein10 (PR10) as a leucine-rich repeat protein1 (LRR1)-interacting partner. Bimolecular fluorescence complementation and coimmunoprecipitation assays confirmed the specific interaction between LRR1 and PR10 in planta. Avirulent Xanthomonas campestris pv vesicatoria infection induces PR10 expression associated with the hypersensitive cell death response. Transient expression of PR10 triggers hypersensitive cell death in pepper and Nicotiana benthamiana leaves, which is amplified by LRR1 coexpression as a positive regulator. LRR1 promotes the ribonuclease activity and phosphorylation of PR10, leading to enhanced cell death signaling. The LRR1-PR10 complex is formed in the cytoplasm, resulting in its secretion into the apoplastic space. Engineered nuclear confinement of both proteins revealed that the cytoplasmic localization of the PR10-LRR1 complex is essential for cell death-mediated defense signaling. PR10/LRR1 silencing in pepper compromises resistance to avirulent X. campestris pv vesicatoria infection. By contrast, PR10/LRR1 overexpression in Arabidopsis thaliana confers enhanced resistance to Pseudomonas syringae pv tomato and Hyaloperonospora arabidopsidis. Together, these results suggest that the cytosolic LRR-PR10 complex is responsible for cell death-mediated defense signaling.


Figures

Figure 1.
Figure 1.
Interaction between LRR1 and PR10 in Yeast and N. benthamiana. (A) LRR1 interacts with PR10 in a GAL4-based yeast two-hybrid system. SD, synthetic dropout. The plasmids encoding the fusions to the GAL4 AD and the DNA BD are denoted by AD and BD, respectively. Combinations of the Simian Vacuolating Virus 40 large T antigen (AD/T) with the murine p53 (BD/p53) fusion constructs and human lamic C (BD/Lam) were included as positive and negative controls, respectively. (B) BiFC visualization of the LRR10/PR10 interaction in leaves infiltrated with Agrobacterium. Yellow fluorescence, visible light, and merged images were taken from the epidermal cells. The bZIP63-YFPN and bZIP63-YFPC constructs were used as positive controls. Bars = 50 μm. (C) co-IP and immunoblotting (IB) of GFP-HA or LRR1-HA and PR10-Myc proteins coexpressed in leaves. GFP-HA was used as a negative control.
Figure 2.
Figure 2.
Transient Expression of LRR1, PR10, and LRR1/PR10 in Pepper Leaves. (A) Immunoblot analysis of the transient expression of LRR1, PR10, and LRR1/PR10. CBB, Coomassie blue staining of the gel to show equal loading. (B) and (C) Cell death phenotypes (B) and electrolyte leakage (C) in leaves infiltrated with Agrobacterium strain GV3101 carrying 35S:00 (empty), 35S:LRR1, 35S:PR10, or 35S:LRR1/35S:PR10. Red, yellow, and black circles indicate full, partial, and no cell death, respectively. (D) and (E) Cell death phenotypes (D) and electrolyte leakage (E) in leaves infiltrated with Agrobacterium at different inoculum ratios. (F) Callose deposition (bright blue dots) in leaves infiltrated with Agrobacterium. Number of callose deposits mm−2 represents the mean ± sd from three leaf discs. Bars = 500 μm. (C), (E), and (F) Data represent the means ± sd from three independent experiments. Different letters above the bars indicate significantly different means (P < 0.05), as analyzed by Fisher's protected LSD test.
Figure 3.
Figure 3.
Transient Expression of LRR1, PR10, LRR1/PR10, avrPto/Pto, and Bax in N. benthamiana Leaves. (A) Cell death phenotypes in leaves infiltrated with Agrobacterium strain GV3101 carrying different constructs. Red and black circles indicate full and no cell death, respectively. (B) Quantification of electrolyte leakage as ion conductivity to assess the cell death response in leaf discs. (C) Quantitative real-time RT-PCR analysis of the expression of LRR1, PR10, HSR203J, and VPR1a in N. benthamiana leaves 24 h after agroinfiltration. (B) and (C) Data represent the means ± sd from three independent experiments. Different letters above the bars indicate significantly different means (P < 0.05), as analyzed by Fisher's protected LSD test.
Figure 4.
Figure 4.
Synergistic Effect of LRR1 on RNase Activity and Phosphorylation of PR10. (A) Detection of RNase activity of PR10 on 15% acrylamide gel containing yeast RNA. After electrophoresis of recombinant PR10 and LRR1 proteins mixed at different concentrations, the gel was stained with toluidine blue O. (B) RNase activity assay of PR10 in the presence of LRR1 using yeast RNA. (C) Pro-Q diamond staining and immunoblot (IB) analysis using a phosphoserine antibody for the detection of PR10 phosphorylation. (D) Quantification of phosphorylation by the detection of Pro-Q diamond fluorescence using ProXPRESS. Phosphorylation reactions were done using different concentrations of PR10 and LRR1 (0.1 to ~5.0 μg). (B) and (D) Data represent the means ± sd from three independent experiments. Different letters indicate significantly different means, as analyzed by Fisher's protected LSD test (P < 0.05).
Figure 5.
Figure 5.
Cytoplasmic Localization of the LRR1/PR10 Complex Is Essential for Cell Death Induction. (A) Subcellular localization of NLS- or nls-fused LRR1 and PR10 in N. benthamiana leaves. DAPI images indicate nuclear staining. All images were taken by confocal microscopy 24 h after agroinfiltration. Bars = 20 μm. (B) BiFC images of NLS- or nls-fused LRR10/PR10 combinations in leaves infiltrated with Agrobacterium. Bars = 50 μm. (C) Immunoblot (IB) analysis of LRR1-Myc and PR10-HA in nuclear and cytoplasmic fractions of leaves transiently expressing NLS- or nls-fused LRR1 or PR10. Histone H3 and Hsc70 were included as fractionation markers for the nucleus and the cytoplasm, respectively. (D) Induction of the cell death response by transient expression of nls-fused LRR10/PR10 combinations 3 d after agroinfiltration. (E) Quantification of electrolyte leakage as ion conductivity to assess the cell death response. Data represent the means ± sd from three independent experiments. Different letters indicate significantly different means, as analyzed by Fisher’s protected LSD test (P < 0.05).
Figure 6.
Figure 6.
Distinct Responses of LRR1-, PR10-, and LRR1/PR10-Silenced Pepper Plants to Xcv Infection. (A) Bacterial growth in leaves infected with Xcv (5 × 10⁴ cfu mL−1). (B) Trypan blue staining (top) with leaves 24 h after inoculation with Xcv (107 cfu mL−1). Quantification of electrolyte leakage (bottom) from leaves infected with Xcv (107 cfu mL−1). Bars = 500 μm. (C) DAB staining (top) to detect H2O2 production in leaves infected with Xcv (107 cfu mL−1). Quantification of H2O2 production in leaf tissues (bottom), as determined by ImageJ software. Bars = 500 μm. Data represent the means ± sd from three independent experiments. Different letters indicate significant differences, as determined by Fisher’s protected LSD test (P < 0.05).
Figure 7.
Figure 7.
Silencing of LRR1/PR10 Compromises Defense Gene Expression and SA Accumulation in Pepper Leaves Infected by Xcv. (A) Quantitative real-time RT-PCR analysis of the expression of defense response genes in the leaves 24 h after Xcv inoculation. Expression values are normalized by the expression level of Ca ACTIN. (B) Levels of free SA and total SA (free SA plus its conjugate) in the leaves infected by Xcv. FW, fresh weight. Data represent the means ± sd from three independent experiments. Different letters indicate significant differences, as statistically analyzed by Fisher’s protected LSD test (P < 0.05).
Figure 8.
Figure 8.
Enhanced Resistance of PR10- and LRR1/PR10-OX Transgenic Arabidopsis Plants to Pst Infection. (A) Disease symptoms on leaves 72 h after inoculation. (B) Bacterial growth in the leaves of wild-type and transgenic plants. (C) Micrographs of the leaves stained with trypan blue (left) 24 h after infiltration and quantification of electrolyte leakage (right) from leaf discs. Bars = 500 μm. (D) Micrographs of the leaves stained with DAB (left) 24 h after inoculation and intensity of the reddish color from DAB images (right) to assess H2O2 production. Bars = 500 μm. (B) to (D) Data represent the means ± sd from three independent experiments. Different letters indicate significant differences, as statistically analyzed by Fisher’s protected LSD test (P < 0.05).
Figure 9.
Figure 9.
Real-Time RT-PCR Analysis of Defense Marker Gene Expression in LRR1-, PR10-, and LRR1/PR10-OX Transgenic Arabidopsis Plants. Expression values are normalized by the expression level of ACTIN2. Data represent the means ± sd from three independent experiments. Different letters indicate significant differences, as analyzed by Fisher's protected LSD test (P < 0.05). hai, hours after inoculation with Pst DC3000.
Figure 10.
Figure 10.
Enhanced Resistance of LRR1-, PR10-, and LRR1/PR10-OX Transgenic Arabidopsis Plants to H. arabidopsidis Infection. (A) Disease symptoms and cell responses in the cotyledons inoculated with conidiospores of H. arabidopsidis isolate Noco2. Bars = 200 μm. (B) Quantification of conidiospores on 20 cotyledons. (C) ROS intensities of leaf tissues, as measured by a color densitometer using ImageJ software after DAB staining. (D) Quantification of callose deposition by aniline blue staining. (E) Quantification of asexual sporangiophores on cotyledons. The numbers below each line represent the means ± sd. (B) to (E) Data represent the means ± sd from three independent experiments. Different letters indicate significant differences, as analyzed by Fisher’s protected LSD test (P < 0.05).

Similar articles

Cited by

References

    1. Barna B., Ibenthal W.D., Heitefuss R. (1989). Extracellular RNase activity in healthy and rust-infected wheat leaves. Physiol. Mol. Plant Pathol. 35: 151–160
    1. Breiteneder H., Pettenburger K., Bito A., Valenta R., Kraft D., Rumpold H., Scheiner O., Breitenbach M. (1989). The gene coding for the major birch pollen allergen Betv1, is highly homologous to a pea disease resistance response gene. EMBO J. 8: 1935–1938 - PMC - PubMed
    1. Brodersen P., Petersen M., Pike H.M., Olszak B., Skov S., Ødum N., Jørgensen L.B., Brown R.E., Mundy J. (2002). Knockout of Arabidopsis ACCELERATED-CELL-DEATH11 encoding a sphingosine transfer protein causes activation of programmed cell death and defense. Genes Dev. 16: 490–502 - PMC - PubMed
    1. Bufe A., Spangfort M.D., Kahlert H., Schlaak M., Becker W.-M. (1996). The major birch pollen allergen, Bet v 1, shows ribonuclease activity. Planta 199: 413–415 - PubMed
    1. Burch-Smith T.M., Schiff M., Caplan J.L., Tsao J., Czymmek K., Dinesh-Kumar S.P. (2007). A novel role for the TIR domain in association with pathogen-derived elicitors. PLoS Biol. 5: e68. - PMC - PubMed

Publication types

MeSH terms

LinkOut - more resources