Comparative Study
. 2012 May;59(5):999-1005.
doi: 10.1161/HYPERTENSIONAHA.111.189662. Epub 2012 Apr 9.

TASK-3 channel deletion in mice recapitulates low-renin essential hypertension

Affiliations
Comparative Study

TASK-3 channel deletion in mice recapitulates low-renin essential hypertension

Nick A Guagliardo et al. Hypertension. 2012 May.

Erratum in

  • Hypertension. 2012 Jun;59(6):e59

Abstract

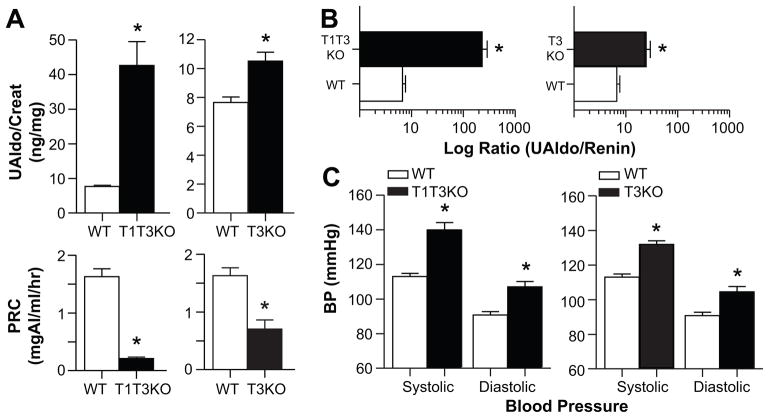
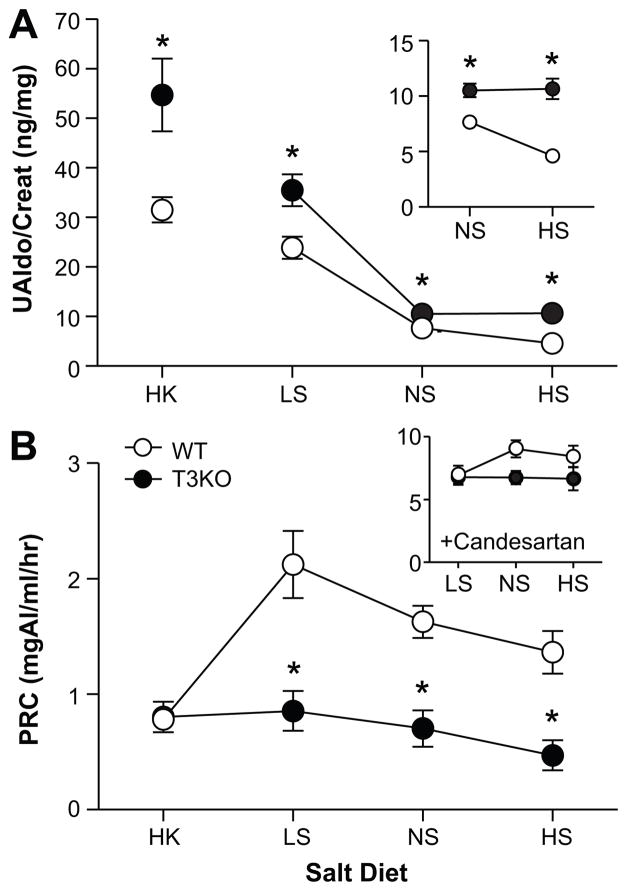
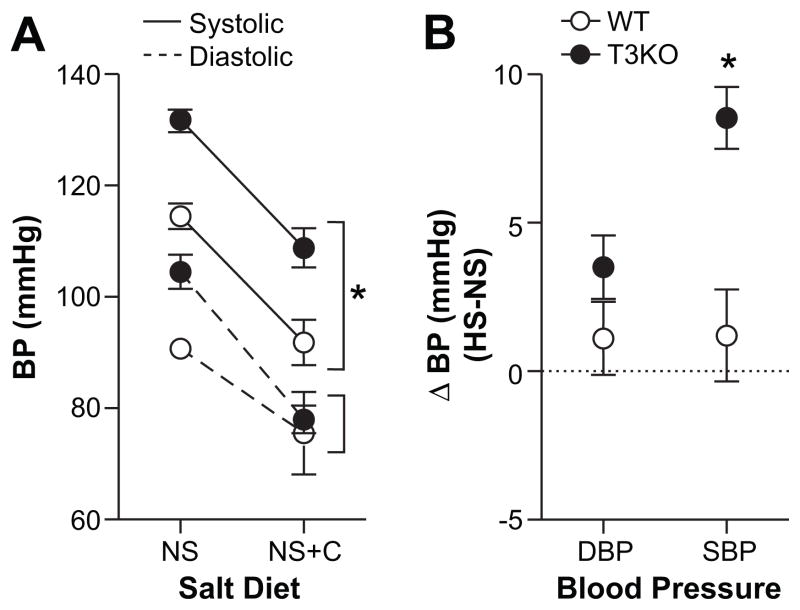
Idiopathic primary hyperaldosteronism (IHA) and low-renin essential hypertension (LREH) are common forms of hypertension, characterized by an elevated aldosterone-renin ratio and hypersensitivity to angiotensin II. They are suggested to be 2 states within a disease spectrum that progresses from LREH to IHA as the control of aldosterone production by the renin-angiotensin system is weakened. The mechanism(s) that drives this progression remains unknown. Deletion of Twik-related acid-sensitive K(+) channels (TASK) subunits, TASK-1 and TASK-3, in mice (T1T3KO) produces a model of human IHA. Here, we determine the effect of deleting only TASK-3 (T3KO) on the control of aldosterone production and blood pressure. We find that T3KO mice recapitulate key characteristics of human LREH, salt-sensitive hypertension, mild overproduction of aldosterone, decreased plasma-renin concentration with elevated aldosterone:renin ratio, hypersensitivity to endogenous and exogenous angiotensin II, and failure to suppress aldosterone production with dietary sodium loading. The relative differences in levels of aldosterone output and aldosterone:renin ratio and in autonomy of aldosterone production between T1T3KO and T3KO mice are reminiscent of differences in human hypertensive patients with LREH and IHA. Our studies establish a model of LREH and suggest that loss of TASK channel activity may be one mechanism that advances the syndrome of low renin hypertension.


Figures

Figure 1
Figure 1
Effect of TASK-3 deletion on urinary aldosterone, plasma renin concentration (PRC), and blood pressure in congenic mice. A, upper, 24-hr. urinary aldosterone excretion normalized to creatinine (ng/mg, UAldo/creatinine) in T1T3KO (black bars, left; n=12), T3KO (black bars, right; n=31) and WT mice (white bars, n=38) on NS diet (0.32% Na+, 0.8% K+; 7 days on diet). A, lower, PRC (mg Ang I/ml/hr) of same WT and KO mice. B, Ratio of UAldo to PRC calculated per mouse and averaged per genotype. C, 24-hr. SBPs and DBPs of conscious mice: T1T3KO (n=5), T3KO (n=11), WT (n=11) using radio-telemetry. Values represent mean ± SEM; *comparison to WT mice (P<0.05).
Figure 2
Figure 2
Effect of diet on UAldo and PRC. A, 24-hr. UAldo/creatinine (ng/mg) of WT (white circles) and T3KO mice (black circles) on each of four salt diets: HK (n=11 per group), LS (n=20-25), NS (n=31-38), HS (n=25-32). A, inset, Expanded scale to show increase in UAldo/creatinine in T3KO versus WT mice on NS or HS diet. B, PRC (mg AngI/ml/hr) of WT and T3KO mice on salt diets. B, inset PRC after candesartan treatment (10mg/kg/day) on LS, NS, or HS for WT and T3KO mice (LS: n=20-25; NS: n=11; HS: n=11). Values represent mean ± SEM; *comparison to WT mice (P<0.05).
Figure 3
Figure 3
Membrane potential, K+ channels and Cyp11β2 expression in the adrenal ZG. T3KO hyperaldosteronism is not explained by differences in ZG baseline Vm, plasma K+, or TASK-1 expression. A, Baseline Vm (mV) of ZG cells in adrenal slices from WT (white bars, n=16) and T3KO mice (black bars, n=17) determined in current clamp. B, Plasma K+ (mmol/L) in WT (white circles) and T3KO mice (black circles) on salt diets (HK: n=11, NS, LS, HS: n=21-26). *Indicates main effect of genotype (P<0.001). C, D, Expression of mRNA (C,TASK-1, TASK-3) and (D, Kcnj5,) in ZG layer isolated by laser microdissection, from WT (n=6) and T3KO (n=6) adrenal slices, measured by RT-PCR and expressed as fold-initial mRNA (2−dCt) relative to actin mRNA. E, mRNA expression of Cyp11β2 in ZG layer, NS (n=6, *P<0.001) or HS (n=4, *P=0.038). F, Western blot analysis of lysates (20 ug total protein) prepared from mouse adrenals (2 adrenals/lane): NS(n=3); HS(n=5); LS(n=4), detected with anti-aldosterone synthase (Cyp11β2) antibody. Values represent mean ± SEM, *comparison to WT mice (P<0.05).
Figure 4
Figure 4
Changes in aldosterone production evoked by Ang II and candesartan. A, Fold increase in 24hr UAldo/creatinine in WT (white circles) and T3KO mice (black circles) induced by exogenous Ang II delivery (s.c. osmotic mini-pumps: 0 (saline vehicle), 0.04, 0.4, 0.8, 1.2, or 4.0 μg/kg/min; n=4-7 per dose). Changes in aldosterone production evoked by vehicle did not differ from that evoked by 0.04 μg Ang II/kg/min (data not included in the graph). *significant difference in dose-response curves between genotypes (P=0.038); EC50 in T3KO mice was ½ that of WT mice. B, Comparison of Ang II-dependent (left) and independent (right) aldosterone production in WT and T3KO mice on Na+ diets (see Figure 2 for n’s). B, upper left, the Ang II-dependent response defined as difference between the UAldo/creatinine before and during candesartan (C) administration (10mg/kg/day). *indicates main effect of genotype (P=0.002). B, upper right, UAldo/creatinine with candesartan defined as Ang II-independent aldosterone production. B, upper insets, expanded scale to highlight differences between genotypes. Values represent mean ± SEM, *comparison to WT mice (P<0.05).
Figure 5
Figure 5
The effects of AT1R blockade and high Na+ diet on ambulatory blood pressure. A, 24-hr. SBP (solid lines) and DBP (dashed lines) of WT (white circles) and T3KO (black circles) on NS (n=11) and NS with candesartan in drinking water (n=5–6). Candesartan (10mg/kg/day) normalized DBP between WT and T3KO mice, while SBP remained significantly elevated (*P<0.001). B, Increase in 24-hr. SBPs (solid lines) and DBPs (dashed lines) induced by HS (ΔHS-NS; n=4-6 per condition). SBP and DBP in WT mice failed to respond to HS challenge (n=6), whereas T3KO mice showed increase in SBP (*P<0.001, n=4), but not DBP (P=0.077, n=4). Values represent mean ± SEM, *comparison to WT mice (P<0.05).

Similar articles

Cited by

References

    1. Funder JW, Carey RM, Fardella C, Gomez-Sanchez CE, Mantero F, Stowasser M, Young WF, Jr, Montori VM. Case detection, diagnosis, and treatment of patients with primary aldosteronism: An endocrine society clinical practice guideline. J Clin Endocrinol Metab. 2008;93:3266–3281. - PubMed
    1. Gordon RD, Laragh JH, Funder JW. Low renin hypertensive states: Perspectives, unsolved problems, future research. Trends Endocrinol Metab. 2005;16:108–113. - PubMed
    1. Mulatero P, Verhovez A, Morello F, Veglio F. Diagnosis and treatment of low-renin hypertension. Clin Endocrinol (Oxf) 2007;67:324–334. - PubMed
    1. Stowasser M, Gordon RD. The aldosterone-renin ratio and primary aldosteronism. Mayo Clin Proc. 2002;77:202–203. - PubMed
    1. Tomaschitz A, Maerz W, Pilz S, Ritz E, Scharnagl H, Renner W, Boehm BO, Fahrleitner-Pammer A, Weihrauch G, Dobnig H. Aldosterone/renin ratio determines peripheral and central blood pressure values over a broad range. J Am Coll Cardiol. 2010;55:2171–2180. - PubMed

Publication types

MeSH terms