

Greater focus needed on methane leakage from natural gas infrastructure
- PMID: 22493226
- PMCID: PMC3340093
- DOI: 10.1073/pnas.1202407109
Greater focus needed on methane leakage from natural gas infrastructure
Abstract
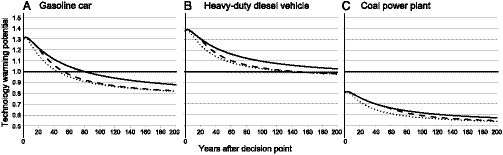
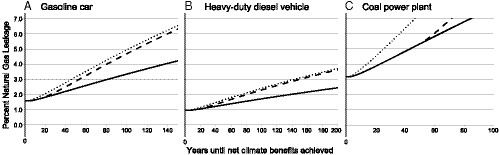
Natural gas is seen by many as the future of American energy: a fuel that can provide energy independence and reduce greenhouse gas emissions in the process. However, there has also been confusion about the climate implications of increased use of natural gas for electric power and transportation. We propose and illustrate the use of technology warming potentials as a robust and transparent way to compare the cumulative radiative forcing created by alternative technologies fueled by natural gas and oil or coal by using the best available estimates of greenhouse gas emissions from each fuel cycle (i.e., production, transportation and use). We find that a shift to compressed natural gas vehicles from gasoline or diesel vehicles leads to greater radiative forcing of the climate for 80 or 280 yr, respectively, before beginning to produce benefits. Compressed natural gas vehicles could produce climate benefits on all time frames if the well-to-wheels CH(4) leakage were capped at a level 45-70% below current estimates. By contrast, using natural gas instead of coal for electric power plants can reduce radiative forcing immediately, and reducing CH(4) losses from the production and transportation of natural gas would produce even greater benefits. There is a need for the natural gas industry and science community to help obtain better emissions data and for increased efforts to reduce methane leakage in order to minimize the climate footprint of natural gas.
Conflict of interest statement
The authors declare no conflict of interest.
Figures
Comment in
-
Temperature change vs. cumulative radiative forcing as metrics for evaluating climate consequences of energy system choices.Proc Natl Acad Sci U S A. 2012 Jul 3;109(27):E1813; author reply E1814. doi: 10.1073/pnas.1206019109. Epub 2012 Jun 18. Proc Natl Acad Sci U S A. 2012. PMID: 22711843 Free PMC article. No abstract available.
References
-
- Howarth RW, Santoro R, Ingraffea A. Methane and the greenhouse-gas footprint of natural gas from shale formations. Clim Change. 2011;106:679–690.
-
- Venkatesh A, Jaramillo P, Griffin WM, Matthews HS. Uncertainty in life-cycle greenhouse gas emissions from United States natural gas end-uses and its effect on policy. Environ Sci Technol. 2011;45:8181–8189. - PubMed
-
- Cathles LM, Brown L, Taam M, Hunter A. A commentary on “The greenhouse-gas footprint of natural gas in shale formations” by R. W. Howarth, R. Santoro, and Anthony Ingraffea. Clim Change. 2012 10.1007/s10584-011-0333-0. - DOI
-
- Burnham A, et al. Life-cycle greenhouse gas emissions of shale gas, natural gas, coal and petroleum. Environ Sci Technol. 2012;46:619–627. - PubMed
-
- Wigley TML. Coal to gas: The influence of methane leakage. Clim Change. 2011;108:601–608.
LinkOut - more resources
Full Text Sources
Other Literature Sources
