

Protein-tyrosine phosphatases are involved in interferon resistance associated with insulin resistance in HepG2 cells and obese mice
- PMID: 22493491
- PMCID: PMC3365992
- DOI: 10.1074/jbc.M112.342709
Protein-tyrosine phosphatases are involved in interferon resistance associated with insulin resistance in HepG2 cells and obese mice
Abstract
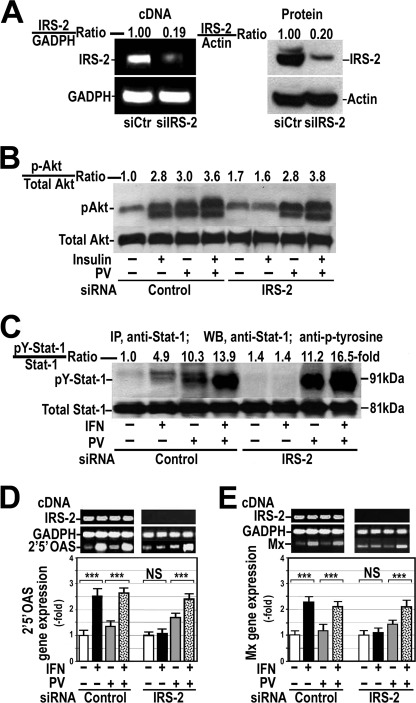
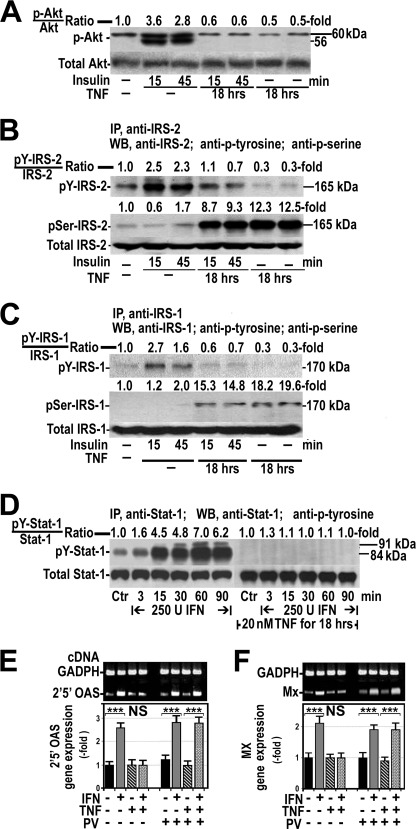
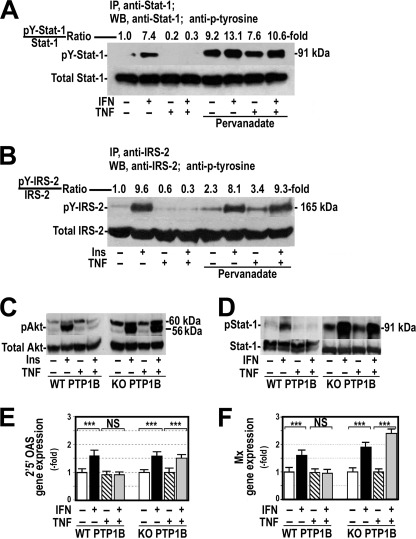
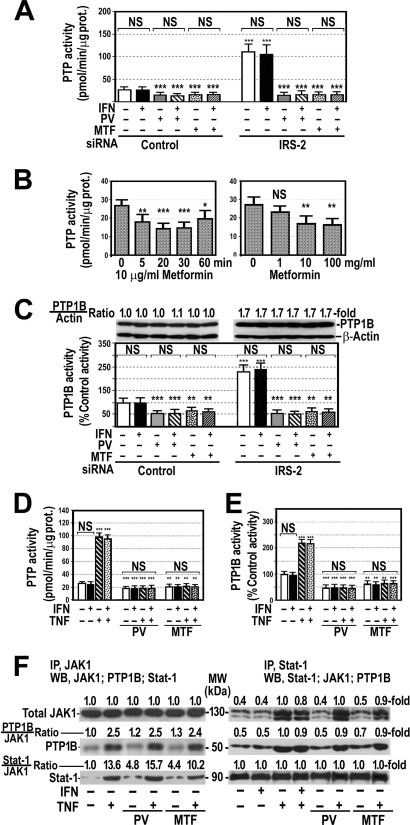
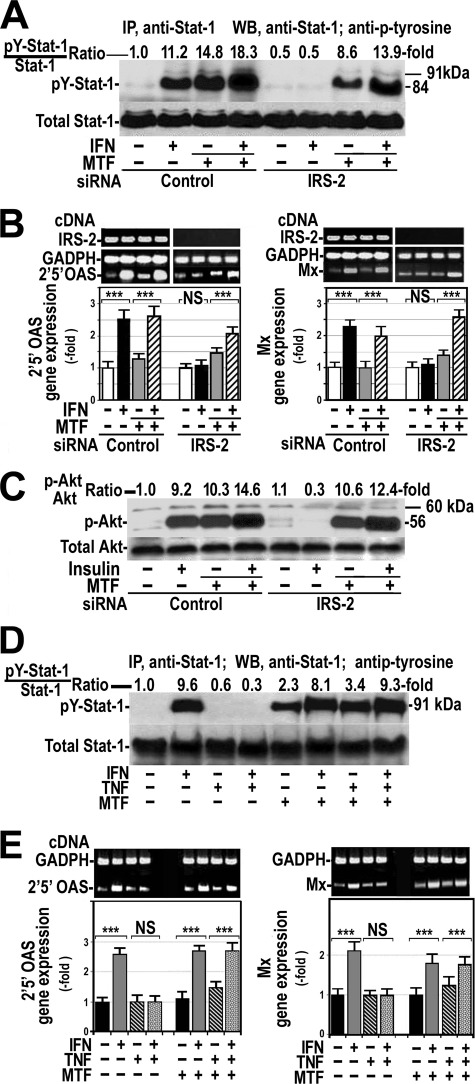
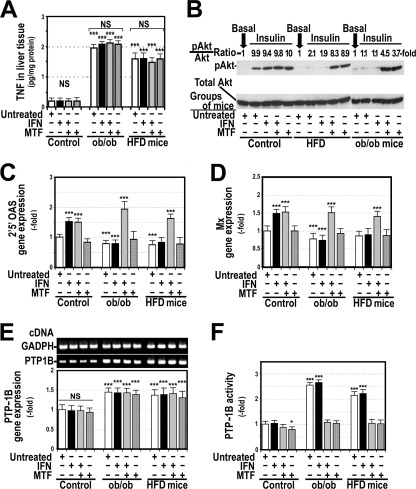
Insulin resistance is a risk factor for non-response to interferon/ribavirin therapy in patients with chronic hepatitis C. The aim of this study was to determine the role played by protein-tyrosine phosphatases (PTPs) in the absence of interferon-α (IFNα) response associated with insulin resistance. We induced insulin resistance by silencing IRS-2 or by treating HepG2 cells with tumor necrosis factor-α (TNFα) and analyzed insulin response by evaluating Akt phosphorylation and IFNα response by measuring Stat-1 tyrosine phosphorylation and 2',5'-oligoadenylate synthase and myxovirus resistance gene expression. The response to IFNα was also measured in insulin-resistant obese mice (high fat diet and ob/ob mice) untreated and treated with metformin. Silencing IRS-2 mRNA induces insulin resistance and inhibits IFNα response. Likewise, TNFα suppresses insulin and IFNα response. Treatment of cells with pervanadate and knocking down PTP-1B restores insulin and IFNα response. Both silencing IRS-2 and TNFα treatment increase PTP and PTP-1B activity. Metformin inhibits PTP and improves IFNα response in insulin-resistant cells. Insulin-resistant ob/ob mice have increased PTP-1B gene expression and activity in the liver and do not respond to IFNα administration. Treatment with metformin improves this response. In HepG2 cells, insulin resistance provokes IFNα resistance, which is associated with an increased PTP-1B activity in the liver. Inhibition of PTP-1B activity with pervanadate and metformin or knocking down PTP-1B reestablishes IFNα response. Likewise, metformin decreases PTP-1B activity and improves response to IFNα in insulin-resistant obese mice. The use of PTP-1B inhibitors may improve the response to IFNα/ribavirin therapy.
Figures
Similar articles
-
Rosiglitazone attenuates tumor necrosis factor-α-induced protein-tyrosine phosphatase-1B production in HepG2 cells.J Endocrinol Invest. 2012 Jan;35(1):28-34. doi: 10.3275/7629. Epub 2011 Apr 6. J Endocrinol Invest. 2012. PMID: 21483233
-
Protein tyrosine phosphatase-1B (PTP-1B) knockdown improves palmitate-induced insulin resistance in C2C12 skeletal muscle cells.Lipids. 2010 Mar;45(3):237-44. doi: 10.1007/s11745-010-3394-3. Epub 2010 Feb 23. Lipids. 2010. PMID: 20177806
-
Fumosorinone, a novel PTP1B inhibitor, activates insulin signaling in insulin-resistance HepG2 cells and shows anti-diabetic effect in diabetic KKAy mice.Toxicol Appl Pharmacol. 2015 May 15;285(1):61-70. doi: 10.1016/j.taap.2015.03.011. Epub 2015 Mar 18. Toxicol Appl Pharmacol. 2015. PMID: 25796170
-
Protein tyrosine phosphatase 1B inhibitors as antidiabetic agents - A brief review.Bioorg Chem. 2017 Feb;70:267-283. doi: 10.1016/j.bioorg.2016.12.004. Epub 2016 Dec 26. Bioorg Chem. 2017. PMID: 28043717 Review.
-
Insulin resistance associated to obesity: the link TNF-alpha.Arch Physiol Biochem. 2008 Jul;114(3):183-94. doi: 10.1080/13813450802181047. Arch Physiol Biochem. 2008. PMID: 18629684 Review.
Cited by
-
The hepatitis C virus modulates insulin signaling pathway in vitro promoting insulin resistance.PLoS One. 2012;7(10):e47904. doi: 10.1371/journal.pone.0047904. Epub 2012 Oct 25. PLoS One. 2012. PMID: 23133528 Free PMC article.
-
Vanadium Complexes with Thioanilide Derivatives of Amino Acids: Inhibition of Human Phosphatases and Specificity in Various Cell Models of Metabolic Disturbances.Pharmaceuticals (Basel). 2024 Feb 9;17(2):229. doi: 10.3390/ph17020229. Pharmaceuticals (Basel). 2024. PMID: 38399444 Free PMC article.
-
An integrative approach for a network based meta-analysis of viral RNAi screens.Algorithms Mol Biol. 2015 Feb 13;10:6. doi: 10.1186/s13015-015-0035-7. eCollection 2015. Algorithms Mol Biol. 2015. PMID: 25691914 Free PMC article.
-
Diabetes and Hepatitis C: A Two-Way Association.Front Endocrinol (Lausanne). 2015 Sep 14;6:134. doi: 10.3389/fendo.2015.00134. eCollection 2015. Front Endocrinol (Lausanne). 2015. PMID: 26441826 Free PMC article. Review.
-
Interferon receptor signaling in malignancy: a network of cellular pathways defining biological outcomes.Mol Cancer Res. 2014 Dec;12(12):1691-703. doi: 10.1158/1541-7786.MCR-14-0450. Epub 2014 Sep 12. Mol Cancer Res. 2014. PMID: 25217450 Free PMC article. Review.
References
-
- Jacobson I. M., Brown R. S., Jr., Freilich B., Afdhal N., Kwo P. Y., Santoro J., Becker S., Wakil A. E., Pound D., Godofsky E., Strauss R., Bernstein D., Flamm S., Pauly M. P, Mukhopadhyay P., Griffel L. H., Brass C. A., and WIN-R Study Group (2007) Peginterferon alfa-2b and weight-based or flat-dose ribavirin in chronic hepatitis C patients. A randomized trial. Hepatology 46, 971–981 - PubMed
-
- Romero-Gómez M., Del Mar Viloria M., Andrade R. J., Salmerón J., Diago M., Fernández-Rodríguez C. M., Corpas R., Cruz M., Grande L., Vázquez L., Muñoz-De-Rueda P., López-Serrano P., Gila A., Gutiérrez M. L., Pérez C., Ruiz-Extremera A., Suárez E., Castillo J. (2005) Insulin resistance impairs sustained response rate to peginterferon plus ribavirin in chronic hepatitis C patients. Gastroenterology 128, 636–641 - PubMed
-
- Taguchi A., White M. F. (2008) Insulin-like signaling, nutrient homeostasis, and life span. Annu. Rev. Physiol. 70, 191–212 - PubMed
-
- Emanuelli B., Peraldi P., Filloux C., Chavey C., Freidinger K., Hilton D. J., Hotamisligil G. S., Van Obberghen E. (2001) SOCS-3 inhibits insulin signaling and is up-regulated in response to tumor necrosis factor-α in the adipose tissue of obese mice. J. Biol. Chem. 276, 47944–47949 - PubMed
-
- Bernsmeier C., Duong F. H., Christen V., Pugnale P., Negro F., Terracciano L., Heim M. H. (2008) Virus-induced over-expression of protein phosphatase 2A inhibits insulin signaling in chronic hepatitis C. J. Hepatol. 49, 429–440 - PubMed
Publication types
MeSH terms
Substances
LinkOut - more resources
Full Text Sources
Other Literature Sources
Research Materials
Miscellaneous
