

Quantitative proteomic analysis of eight cartilaginous tissues reveals characteristic differences as well as similarities between subgroups
- PMID: 22493511
- PMCID: PMC3365926
- DOI: 10.1074/jbc.M111.298968
Quantitative proteomic analysis of eight cartilaginous tissues reveals characteristic differences as well as similarities between subgroups
Abstract
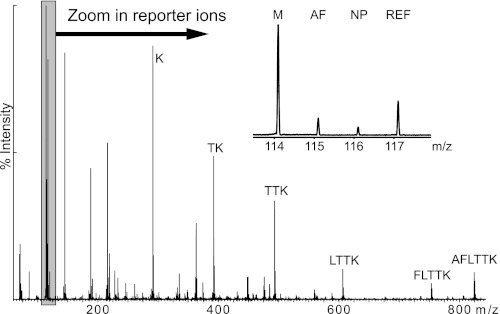
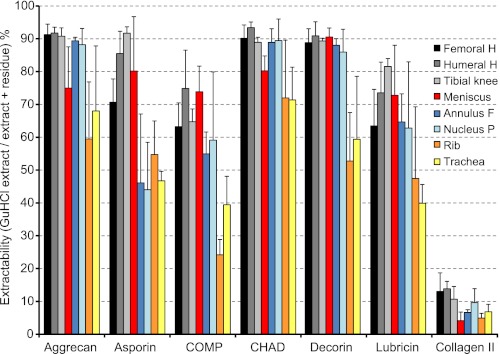
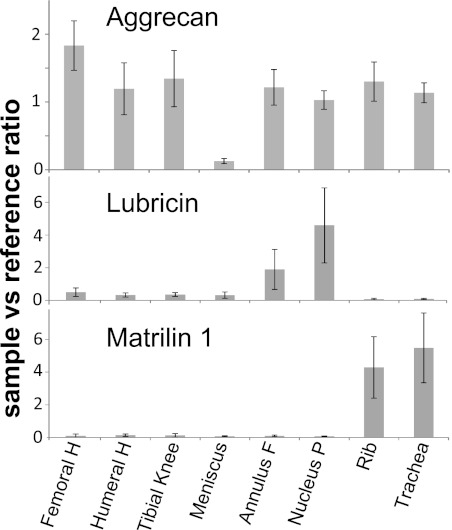
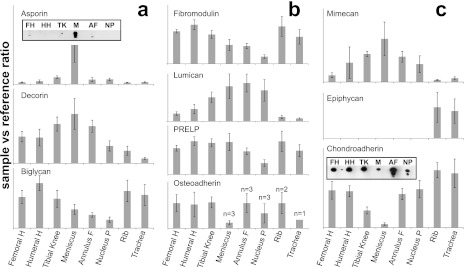
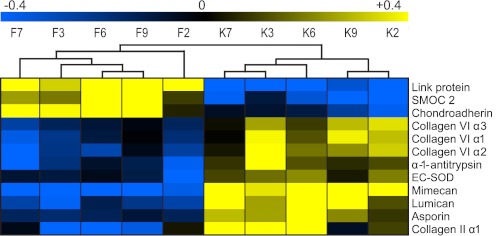
Human synovial joints display a characteristic anatomic distribution of arthritis, e.g. rheumatoid arthritis primarily affects the metacarpophalangeal and proximal finger joints, but rarely the distal finger joints, whereas osteoarthritis occurs in the distal and proximal finger joints. Pelvospondylitis has a selective localization to the spine and sacroiliac joints. Is this tropism due to differences between the cartilages at the molecular level? To substantiate this concept the present study provides a background detailed compositional analysis by relative quantification of extracellular matrix proteins in articular cartilages, meniscus, intervertebral disc, rib, and tracheal cartilages on samples from 5-6 different individuals using an optimized approach for proteomics. Tissue extraction followed by trypsin digestion and two-dimensional LC separations coupled to tandem mass spectrometry, relative quantification with isobaric labeling, iTRAQ(TM), was used to compare the relative abundance of about 150 proteins. There were clear differences in protein patterns between different kinds of cartilages. Matrilin-1 and epiphycan were specific for rib and trachea, whereas asporin was particularly abundant in the meniscus. Interestingly, lubricin was prominent in the intervertebral disc, especially in the nucleus pulposus. Fibromodulin and lumican showed distributions that were mirror images of one other. Analyses of the insoluble residues from guanidine extraction revealed that a fraction of several proteins remained unextracted, e.g. asporin, CILP, and COMP, indicating cross-linking. Distinct differences in protein patterns may relate to different tissue mechanical properties, and to the intriguing tropism in different patterns of joint pathology.
Figures
References
-
- Eyre D. R., Weis M. A., Wu J. J. (2006) Articular cartilage collagen. An irreplaceable framework? Eur. Cell Mater. 12, 57–63 - PubMed
-
- Kalamajski S., Oldberg A. (2010) The role of small leucine-rich proteoglycans in collagen fibrillogenesis. Matrix Biol. 29, 248–253 - PubMed
-
- Hermansson M., Sawaji Y., Bolton M., Alexander S., Wallace A., Begum S., Wait R., Saklatvala J. (2004) Proteomic analysis of articular cartilage shows increased type II collagen synthesis in osteoarthritis and expression of inhibin betaA (activin A), a regulatory molecule for chondrocytes. J. Biol. Chem. 279, 43514–43521 - PubMed
Publication types
MeSH terms
Substances
Grants and funding
LinkOut - more resources
Full Text Sources
Other Literature Sources
Medical
Miscellaneous
