. 2012;7(3):e32885.
doi: 10.1371/journal.pone.0032885. Epub 2012 Mar 30.

Event timing in associative learning: from biochemical reaction dynamics to behavioural observations

Affiliations

Event timing in associative learning: from biochemical reaction dynamics to behavioural observations

Ayse Yarali et al. PLoS One. 2012.

Abstract

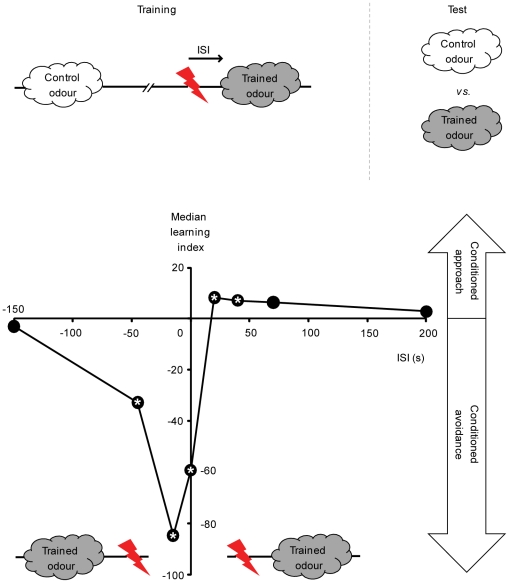
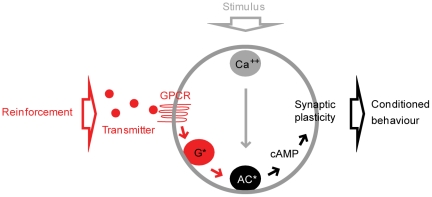
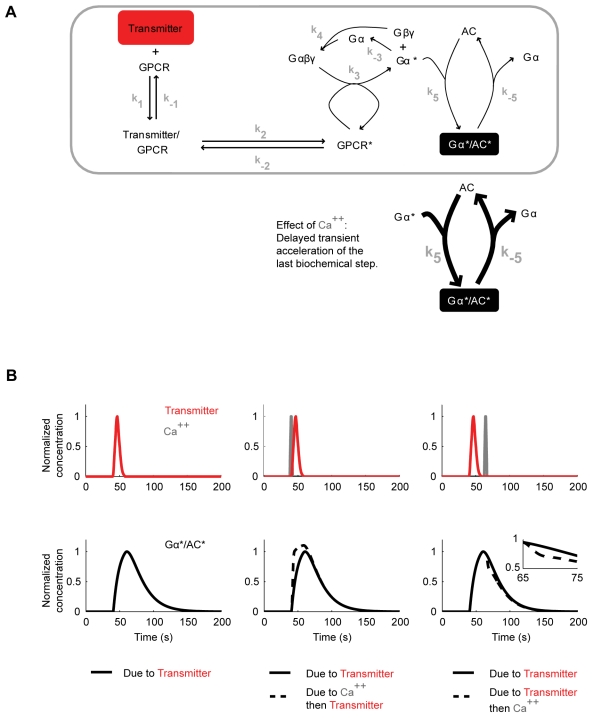
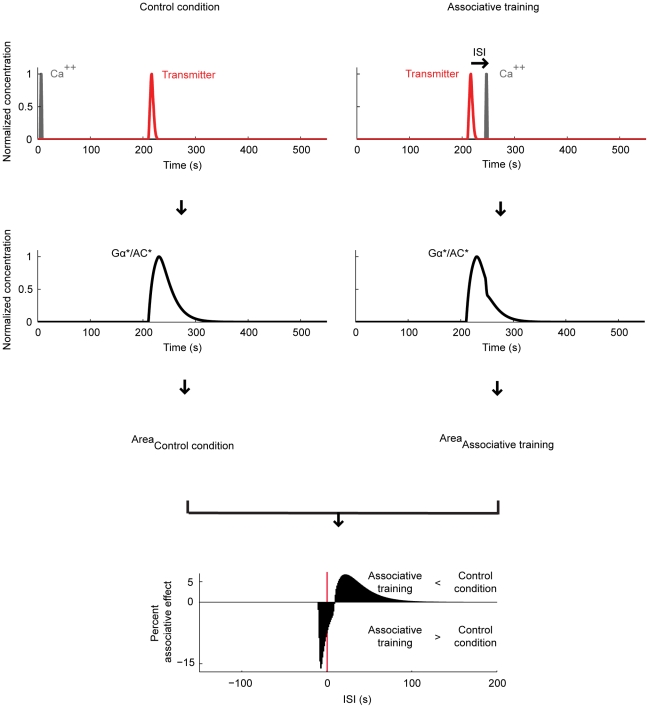
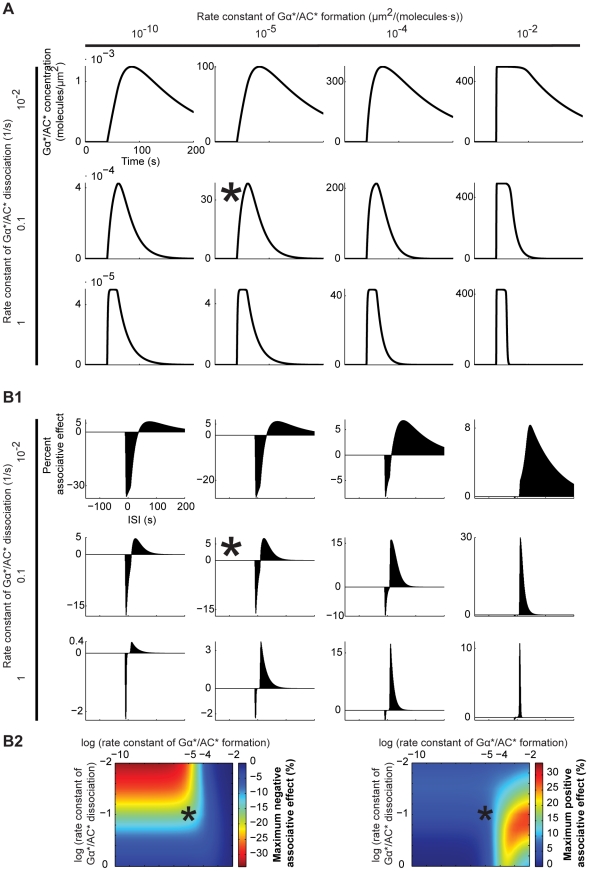
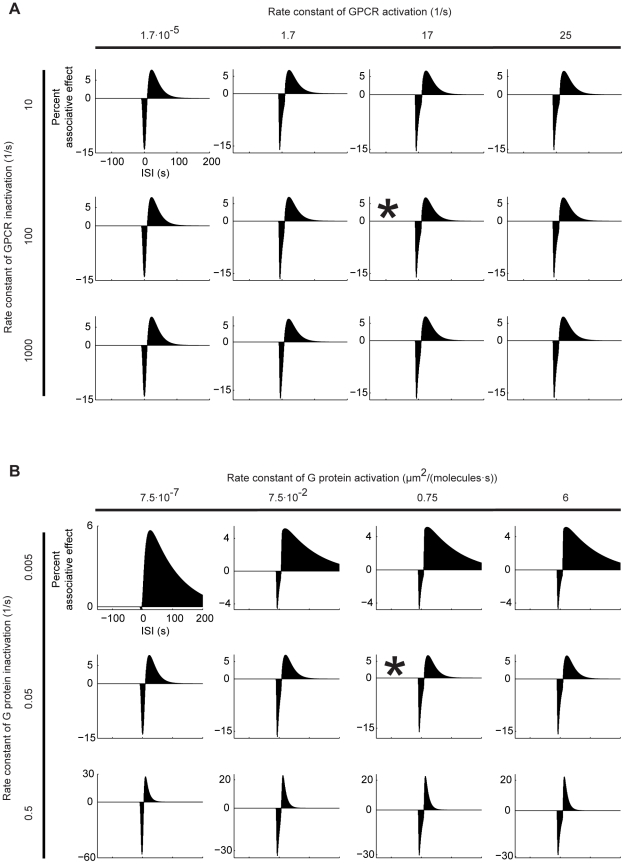
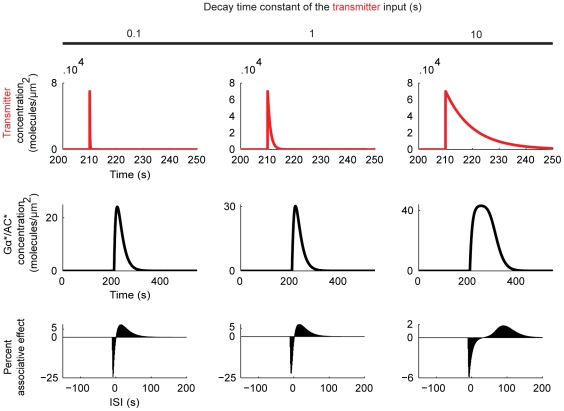
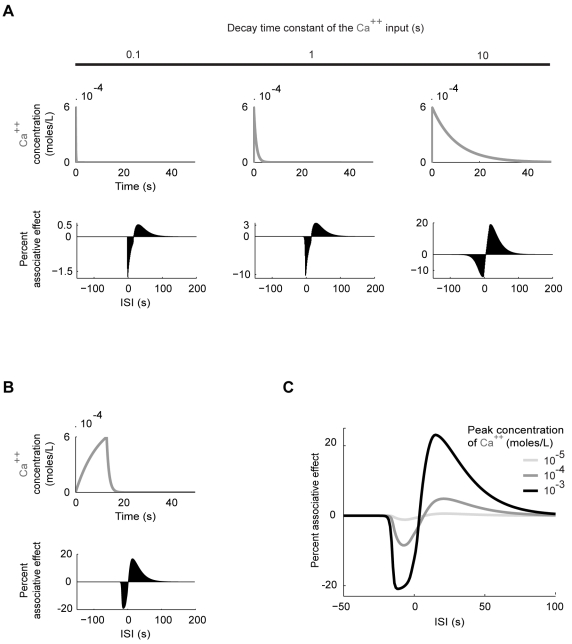
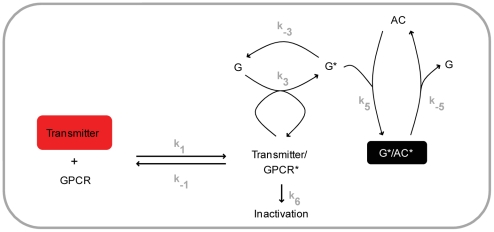
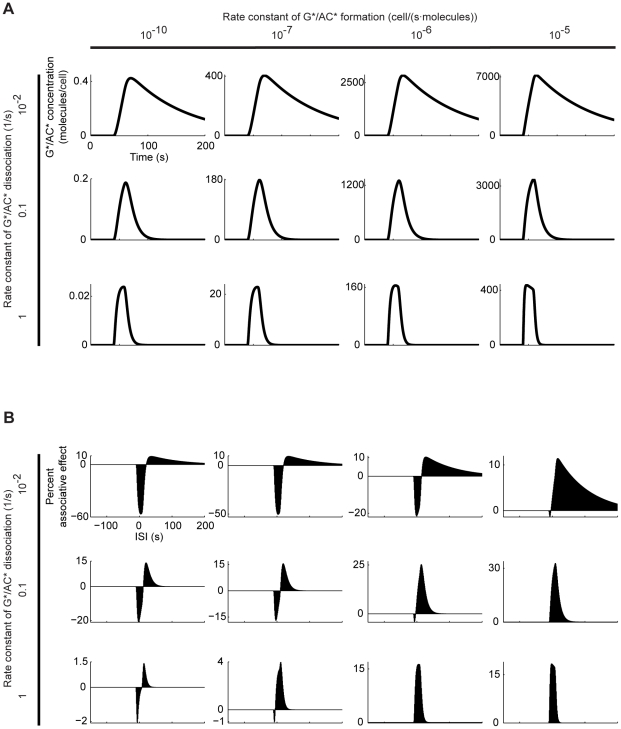
Associative learning relies on event timing. Fruit flies for example, once trained with an odour that precedes electric shock, subsequently avoid this odour (punishment learning); if, on the other hand the odour follows the shock during training, it is approached later on (relief learning). During training, an odour-induced Ca(++) signal and a shock-induced dopaminergic signal converge in the Kenyon cells, synergistically activating a Ca(++)-calmodulin-sensitive adenylate cyclase, which likely leads to the synaptic plasticity underlying the conditioned avoidance of the odour. In Aplysia, the effect of serotonin on the corresponding adenylate cyclase is bi-directionally modulated by Ca(++), depending on the relative timing of the two inputs. Using a computational approach, we quantitatively explore this biochemical property of the adenylate cyclase and show that it can generate the effect of event timing on associative learning. We overcome the shortage of behavioural data in Aplysia and biochemical data in Drosophila by combining findings from both systems.


Conflict of interest statement

Competing Interests: The authors have declared that no competing interests exist.

Figures

Figure 1
Figure 1. Event timing affects associative learning.
Fruit flies are trained such that a control odour is presented alone, whereas a trained odour is paired with pulses of electric shock as reinforcement. Across groups, the inter-stimulus interval (ISI) between the onsets of the trained odour and shock is varied. Here, ISI is defined such that for negative ISI values, the trained odour precedes shock; positive ISI values mean that the trained odour follows shock. For each ISI, two fly subgroups are trained with switched roles for two odours (not shown). During the test, each subgroup is given the choice between the two odours; the difference between their preferences is taken as the learning index. Positive learning indices indicate conditioned approach to the trained odour, negative values reflect conditioned avoidance. Very long training ISIs support no significant conditioned behaviour. If the odour shortly precedes or overlaps with shock during training (ISI = −45 s, −15 s or 0 s), it is strongly avoided in the test (punishment learning). If the odour closely follows the shock-offset during training (ISI = 20 s or 40 s), flies approach it in the test (relief learning). *: P<0.05/8 while comparing to zero in a sign test. Sample sizes are N = 8, 24, 34, 47, 24, 35, 12 and 12. Data from , with permission from Informa healthcare.
Figure 2
Figure 2. Adenylate cyclase as a molecular coincidence detector.
In a variety of associative learning systems, a potential coincidence between the trained stimulus and the reinforcement is detected at the pre-synapse by a particular kind of adenylate cyclase. The stimulus acts on the respective neurons, raising the intracellular Ca++ concentration. The reinforcement induces the release of a transmitter that binds to its respective G protein coupled receptors (GPCR) on the very same neurons and activates the G protein (G*). If stimulus and reinforcement are appropriately timed, the two types of input act synergistically on the adenylate cyclase (AC*), triggering cAMP signalling, and thus lead to the strengthening of the output from these neurons to the respective conditioned behaviour pathway.
Figure 3
Figure 3. Regulation of the adenylate cyclase by the transmitter and Ca++.
A. Adapting the model of Rospars et al. , the transmitter reversibly binds to its respective G protein coupled receptor (GPCR) to form a complex, resulting in reversible receptor activation (GPCR*). GPRC* catalyzes the dissociation of the trimeric G protein (Gαβγ) into an activated α-subunit (Gα*) and the β- and γ-subunits (Gβγ). Gα* spontaneously deactivates (Gα) and reassembles with Gβγ, or it reversibly interacts with the adenylate cyclase (AC) to form an enzymatically active complex (Gα*/AC*), which serves as the output. Following data from Aplysia –, Ca++ in turn transiently increases the rate constants for both the formation and the dissociation of the Gα*/AC* complex (represented by the thickened arrows). The ksubscript denote the rate constants of the respective reactions. B. When this model is stimulated with a transmitter input alone the Gα*/AC* concentration rises to a peak of ∼0.42 molecules/µm2 in ∼20 s after stimulus onset, and decays back to zero within the next ∼100 s (left). If a Ca++ input immediately precedes the transmitter, the build-up of the Gα*/AC* concentration is transiently accelerated (middle). If on the other hand the Ca++ input follows the transmitter, the decay of the Gα*/AC* concentration is transiently accelerated (right). For graphical reasons, normalized concentrations are calculated by dividing with the peak Gα*/AC* concentration given transmitter input alone. The transmitter concentration reaches a peak of ∼6.7·104 molecules/µm2 in ∼7 s and decays back to zero within ∼18 s; the Ca++ concentration starts rising ∼4.5 s after the onset, reaches a peak value of 5.6·10−4 moles/L at ∼6 s and decays back to zero within ∼8.5 s after the onset. Also these inputs are plotted as normalized concentrations.
Figure 4
Figure 4. Relative timing of the transmitter and Ca++ affects the adenylate cyclase.
We stimulate the model with transmitter and Ca++ (see Fig. 3B for the details). In the ‘control condition’ (left), Ca++ precedes the transmitter by an onset-to-onset interval of 210 s. In ‘associative training’ (right), the two inputs follow each other with an inter-stimulus interval (ISI), which is varied across experiments. Negative ISIs indicate training with first Ca++ and then the transmitter; positive ISIs mean the opposite sequence of inputs. For either condition, we take the area under the respective Gα*/AC* concentration curve as a measure of cAMP production. For each ISI, we calculate an ‘associative effect’, by subtracting the amount of cAMP produced during the respective associative training from that in the control condition. We then express the associative effect as percent of the area under the Gα*/AC* concentration curve in the control condition. These percent associative effects are plotted against the ISIs. For very large ISIs, we find no associative effect. If the Ca++ is closely paired with the transmitter, we find negative associative effects; the strongest negative associative effect (−15.5%) is obtained when using ISI ∼−3 s. If on the other hand Ca++ follows the offset of the transmitter during training, we find positive associative effects; the largest positive associative effect (6.3%) is obtained for ISI ∼26 s. Thus, depending on the relative timing of Ca++ and transmitter during training, opposing associative effects come about, closely matching the behavioural situation in Fig. 1.
Figure 5
Figure 5. Influence of the rate constants for Gα*/AC* formation and dissociation.
A. Time course of the Gα*/AC* concentration, following a stimulation of the model with transmitter (see Fig. 3B for the details). B1. ISI-dependent associative effects, as explained in Fig. 4. B2. Color-coded representation of the size of the peak negative (left) and positive (right) associative effects. In (A), (B1) and (B2), we systematically change the rate constants for Gα*/AC* formation and dissociation (k5 and k-5 in Fig. 3A). Using the default values of both rate constants, we obtain associative effects fitting the behavioural situation in Fig. 1 (B1, B2: marked with asterices). Notably, this fit is stable over more than five orders of magnitude of the formation rate constant, but is more sensitive to changes in the dissociation rate constant (B1, B2). The size (B2) and ISI-dependency (B1) of the associative effects are dictated by the dynamics of adenylate cyclase activation/deactivation (A). Particularly, the negative associative effect depends on the rising phase of the Gα*/AC* concentration: When either the formation or the dissociation rate constants are increased beyond their default values, the rising of the Gα*/AC* concentration becomes too fast to be further improved by Ca++; the negative associative effect is thus attenuated. Also, in this case, the short rising phase of Gα*/AC* concentration limits the window of ISI values appropriate for the negative associative effect. In turn, decreasing both rate constants below their default values slows down the rise of Gα*/AC* concentration, leaving more space for improvement by Ca++, thus boosting and -due to the longer rising phase- ‘widening’ the negative associative effect. As for the positive associative effect, the falling phase of the Gα*/AC* concentration matters: When both rate constants are moderately increased beyond their default values, the fall of Gα*/AC* concentration gets faster, that is, the dissociation of Gα*/AC* better dominates over its formation, boosting the positive associative effect. Critically, when the rate constants are increased too much, the drop of Gα*/AC* concentration is accelerated to its limit; thus, both the size and the ‘width’ of the positive associative effect suffer. To summarize, the negative associative effect is favoured by small values of both rate constants, whereas the positive associative effect needs moderately high values of these. Consequently, the overall effect size cannot be improved much beyond the default case, without compromising the relative sizes of the two associative effects with respect to each other and thus the fit to the behavioural situation.
Figure 6
Figure 6. Dependence upon the activation and inactivation rate constants of GPCR and G protein.
The percent associative effect is shown as a function of the ISI, as detailed in Fig. 4. Asterices mark the default conditions. A. Varying the rate constants for GPCR activation and inactivation hardly affects the size, or the ‘shape’ of the associative effects. B. Varying the rate constant of G protein activation also has nearly no bearings on the associative effects. As for the rate constant for G protein inactivation, higher values result in overall larger associative effects; this is because, both the rise and the fall of active adenylate cyclase concentration become moderately faster (not shown, see the legend of Fig. 5 for a more detailed explanation). In both (A) and (B), increasing the respective forward rate constants beyond the depicted range immediately recruits all available adenylate cyclase molecules, precluding any effect of Ca++ and thus any associative effect (not shown).
Figure 7
Figure 7. Influence of the transmitter duration.
With a fixed Ca++ input, three different transmitter inputs are tested (top). They are all initiated at 210 s, rise to a peak of 7·104 molecules/µm2 within 40 ms after the onset, but decay with different time constants as indicated above the panels. We plot the resulting adenylate cyclase dynamics (middle) and the ISI-dependent associative effects (bottom). In terms of the percent sizes of associative effects, changing the transmitter decay time constant from 0.1 to 1 (the first two cases) hardly makes a difference. A slower decaying transmitter input (the last case) broadens the dynamics of adenylate cyclase activation/deactivation, resulting in much higher cAMP production in the control condition; thus, the percent associative effects remain small. As for the ISI-dependence of the associative effects, short transmitter inputs (the first two cases) give good fits to the situation in Fig. 1; when a slower decaying transmitter input is used (the last case), the positive associative effect only occurs for large positive ISIs, due to the broadened adenylate cyclase activation/deactivation dynamics.
Figure 8
Figure 8. Influence of Ca++ duration and intensity.
Complementing the analysis shown in Fig. 7 we now vary the Ca++ input while keeping the transmitter input fixed. In all three examples shown in (A), the Ca++ input rises to a peak of 6·10−4 moles/L within 40 ms after the Ca++ onset, but decays with different time constants, chosen as 0.1 s, 1 s and 10 s (A, top). In this scenario, the associative effects increase with increasing Ca++ duration (A, bottom). In addition, a large decay constant causes a long tail of the Ca++ input that enables negative associative effects for longer ISIs (A, the last case). In (B) we provide an exemplary Ca++ input (B, top) which gives good fit to the behavioural results in Fig. 1 in terms of the ISI-dependency of the associative effects but not in terms of their sizes relative to each other (B, bottom). In this case, the Ca++ concentration rises to a peak of 6·10−4 moles/L within 13 s after the onset, comparing well with the 15s- long odour presentation in Fig. 1. Note that the best negative associative effect occurs with ISI = −13 s, similar to the behavioural situation in Fig. 1. Finally, in (C), we study the effects of the intensity of the Ca++ input. We fix the transmitter input and use the Ca++ input depicted in (B), but scaled up and down by one order of magnitude. The intensity of Ca++ strongly influences the sizes of both the negative and the positive associative effects; the balance between the two is however somewhat compromised with increasing Ca++ intensity.
Figure 9
Figure 9. An alternative model for adenlyate cyclase regulation by the transmitter.
To complement our main analysis based on the model adapted from and shown in Fig. 3A, we finally use a simpler model variant . Here, the transmitter reversibly binds to its respective G protein coupled receptor (GPCR) to form an active complex (Transmitter/GPCR*). This complex then dissociates, or it interacts with the G protein (G) to activate it (G*). The trimeric nature of the G protein is ignored (compare with Fig. 3A). G* on the one hand spontaneously deactivates (G), on the other hand it reversibly interacts with the adenylate cyclase (AC) to form an enzymatically active complex (G*/AC*), which serves as the system's output. The effect of Ca++ is implemented the same way as in Fig. 3A.
Figure 10
Figure 10. Alternative model: Influence of G*/AC* formation and dissociation rate constants.
A. We stimulate the alternative model based on with a transmitter input (details as in Fig. 3B) and plot the time course of the resulting G*/AC* concentration. B. Repeating the experiment in Fig. 4, we plot the percent associative effect as a function of the ISI. Comparison with Fig. 5 shows that despite their various differences both models generate rather similar associative effects.

Similar articles

Cited by

References

    1. Rescorla RA. Behavioral studies of Pavlovian conditioning. Annu Rev Neurosci. 1988;11:329–352. - PubMed
    1. Solomon RL, Corbit JD. An opponent-process theory of motivation. I. Temporal dynamics of affect. Psychol Rev. 1974;81:119–145. - PubMed
    1. Wagner AR. SOP: A model of automatic memory processing in animal behavior. In: Spear NE, Miller RR, editors. Information Processing in Animals: Memory Mechanisms. Hillsdale, NJ: Erlbaum; 1981. pp. 5–47.
    1. Sutton RS, Barto AG. Time-derivative models of pavlovian reinforcement. In: Gabriel M, Moore J, editors. Learning and computational neuroscience: Foundations of adaptive networks. Cambridge, MA: MIT Press; 1990. pp. 497–537.
    1. Chang RC, Blaisdell AP, Miller RR. Backward conditioning: mediation by the context. J Exp Psychol Anim Behav Process. 2003;29:171–183. - PubMed

Publication types

LinkOut - more resources