. 2012;7(4):e33109.
doi: 10.1371/journal.pone.0033109. Epub 2012 Apr 6.

Summer diatom blooms in the North Pacific subtropical gyre: 2008-2009

Affiliations

Summer diatom blooms in the North Pacific subtropical gyre: 2008-2009

Tracy A Villareal et al. PLoS One. 2012.

Abstract

The summertime North Pacific subtropical gyre has widespread phytoplankton blooms between Hawaii and the subtropical front (∼30°N) that appear as chlorophyll (chl) increases in satellite ocean color data. Nitrogen-fixing diatom symbioses (diatom-diazotroph associations: DDAs) often increase 10(2)-10(3) fold in these blooms and contribute to elevated export flux. In 2008 and 2009, two cruises targeted satellite chlorophyll blooms to examine DDA species abundance, chlorophyll concentration, biogenic silica concentration, and hydrography. Generalized observations that DDA blooms occur when the mixed layer depth is < 70 m are supported, but there is no consistent relationship between mixed layer depth, bloom intensity, or composition; regional blooms between 22-34°N occur within a broader temperature range (21-26°C) than previously reported. In both years, the Hemiaulus-Richelia and Rhizosolenia-Richelia DDAs increased 10(2)-10(3) over background concentrations within satellite-defined bloom features. The two years share a common trend of Hemiaulus dominance of the DDAs and substantial increases in the >10 µm chl a fraction (∼40-90+% of total chl a). Integrated diatom abundance varied 10-fold over <10 km. Biogenic silica concentration tracked diatom abundance, was dominated by the >10 µm size fraction, and increased up to 5-fold in the blooms. The two years differed in the magnitude of the surface chl a increase (2009>2008), the abundance of pennate diatoms within the bloom (2009>2008), and the substantially greater mixed layer depth in 2009. Only the 2009 bloom had sufficient chl a in the >10 µm fraction to produce the observed ocean color chl increase. Blooms had high spatial variability; ocean color images likely average over numerous small events over time and space scales that exceed the individual event scale. Summertime DDA export flux noted at the Hawaii time-series Sta. ALOHA is probably a generalized feature of the eastern N. Pacific north to the subtropical front.


Conflict of interest statement

Competing Interests: The authors have declared that no competing interests exist.

Figures

Figure 1
Figure 1. Cruise tracks for 2008 and 2009.
Surface salinity data from the ship’s underway sampling system is color coded along the shiptrack. The climatological mean position of the subtropical front , is shaded in light grey. Bloom areas were derived from ocean color data (see text for details).
Figure 2
Figure 2. Satellite chlorophyll a estimate with overlying stations for 2008.
(a) Hovmöller diagram of MODIS chl showing the development of the 2008 bloom and (b) an 8-day composite showing the maximum extent of the chlorophyll bloom, overlaid with station locations. The black lines on (a) depict the temporal and longitudinal extent of the data shown in (b), and the black lines on (b) depict the latitude range of the data shown in (a). The image is an 8 day composite centered on July 3, 2008. Stas. 1 and 2 (see Table 1) are off the map. Transect 1 (Sta 3–15), Transect 2 (Sta. 16–21).
Figure 3
Figure 3. Vertical profiles of Sta. 1 and 2 (outside the bloom area) in 2008.
A-D Station 1, E-H Sta. 2. A, E. Temperature and Salinity CTD profiles. B, F. Cell and symbiont abundance. C., G. Chl a. (CTD fluorescence, extracted and %>10 µm). D., H. Silicate and biogenic silica concentrations.
Figure 4
Figure 4. Comparison of two stations within the 2008 chl bloom.
Vertical profiles of Sta. 3 &7 in 2008. A-D Station 3 (representative station), E-H Sta. 7 (highest abundance station). A, E. Temperature and Salinity CTD profiles. B, F. Cell and symbiont counts. C., G. Chl a. (CTD fluorescence, extracted and %>10 µm). D., H. Nutrient and biogenic silica concentrations.
Figure 5
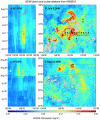
Figure 5. Satellite chlorophyll a estimate with overlying stations for 2009.
(a) Hovmöller diagram of MODIS chl showing the development of the 2009 bloom at 140°W and (b) an 8-day composite showing the maximum extent of the chlorophyll bloom at 140°W, overlaid with station locations. (c) Hovmöller diagram of MODIS chl showing the development of the 2009 bloom at 155°W and (d) an 8-day composite showing the maximum extent of the chlorophyll bloom at 155°W, overlaid with station locations. The black lines on (a) and (c) depict the temporal and longitudinal extent of the data shown in (b) and (d), and the black lines on (b) and (d) depict the latitude range of the data shown in (a) and (b).
Figure 6
Figure 6. Station 22 (A-D) and 23 (E-H) on 12 Aug. 2009.
A, E. Temperature and Salinity CTD profiles. B, F. Cell and symbiont abundance. C., G. Chl a values. D., H. Nutrient and biogenic silica concentrations.
Figure 7
Figure 7. Mixed layer depth versus 0–60 m integrated biomass and abundance.
Error bars represent the range of mixed layer depths observed in multiple CTD casts at individual stations. A. H. hauckii, B. Orange-fluorescing Richelia intracellaris trichomes (filaments) enumerated from 2 liter filtered samples, C. Mastogloia woodiana and associated small pennate diatoms, D. Total (>0.45 µm) chl a, E. >10 µm fraction chl a, F. % chl a in >10 µm size fraction, G. Biogenic silica (>0.6 µm fraction). See methods for 1995, 2002, and 2003 regional data sources.
Figure 8
Figure 8. Species/abundance summary for the 2008/2009 blooms.
Histograms express 0–60 m integrated abundance values for the DDA Hemiaulus hauckii. Individual columns are labeled with year (station number) for reference to the onion plots. The onion plots express the relative species abundance at stations for each year with each taxon color-coded (see Table 1, 2 for numerical data).
Figure 9
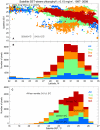
Figure 9. Temperature range for summer blooms detected by ocean color.
A. Satellite sea surface temperature (SST) versus latitude presented as stacked bar graphs for areas with satellite chlorophyll >0.15 mg m−3 between 22–35°N and 160–130°W during July-Oct. for the years 1997–2009. B. Histogram of the prevalence of blooms against latitude. C. Histogram of the prevalence of the SST of the blooms. The data are color-coded by month: July data are blue, August is green, September is orange and October is red. In (A) the average and standard deviation of SST for blooms at Sta. ALOHA that were given in White et. al {, 2007 #22784} are shown by the black circle and error bars. Because of the large number of points (N = 26,302) in (A) not all of them are visible and the plotting order (July–Oct) makes points in Oct. appear more prevalent. The average and standard deviation of the SST south and north of 25.5°N is shown in (A).

References

    1. Wilson C. Late Summer chlorophyll blooms in the oligotrophic North Pacific Subtropical Gyre. Geophysical Research Letters. 2003;30:1942. doi: 1910.1029/2003GL017770.
    1. Villareal TA, Adornato L, Wilson C, Shoenbachler CA. Summer blooms of diatom-diazotroph assemblages (DDAs) and surface chlorophyll in the N. Pacific gyre – a disconnect. Journal of Geophysical Research-Oceans. 2011;116 doi: 10.1029/2010JC006268. - DOI
    1. Wilson C, Villareal TA, Maximenko N, Montoya JP, Bograd SJ, et al. Biological and physical forcings of late summer chlorophyll blooms at 30° N in the oligotrophic Pacific. Journal of Marine Systems. 2008;69:164–176.
    1. Wilson C, Qiu X. Global distribution of summer chlorophyll blooms in the oligotrophic gyres. Progress in Oceanography. 2008;78:107–134.
    1. Dore JE, Letelier RM, Church MJ, Lukas R, Karl DM. Summer phytoplankton blooms in the oligotrophic North Pacific Subtropical Gyre: Historical perspective and recent observations. Progress in Oceanography. 2008;76:2–38.

Publication types