. 2012;7(4):e33394.
doi: 10.1371/journal.pone.0033394. Epub 2012 Apr 6.

Inferring phylogenies from RAD sequence data

Affiliations

Inferring phylogenies from RAD sequence data

Benjamin E R Rubin et al. PLoS One. 2012.

Abstract

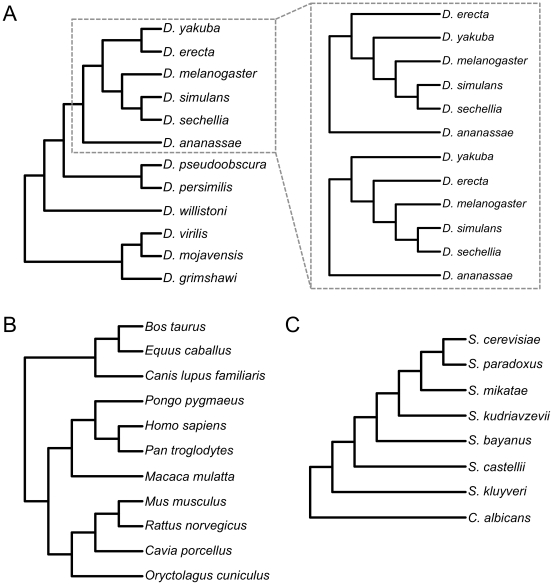
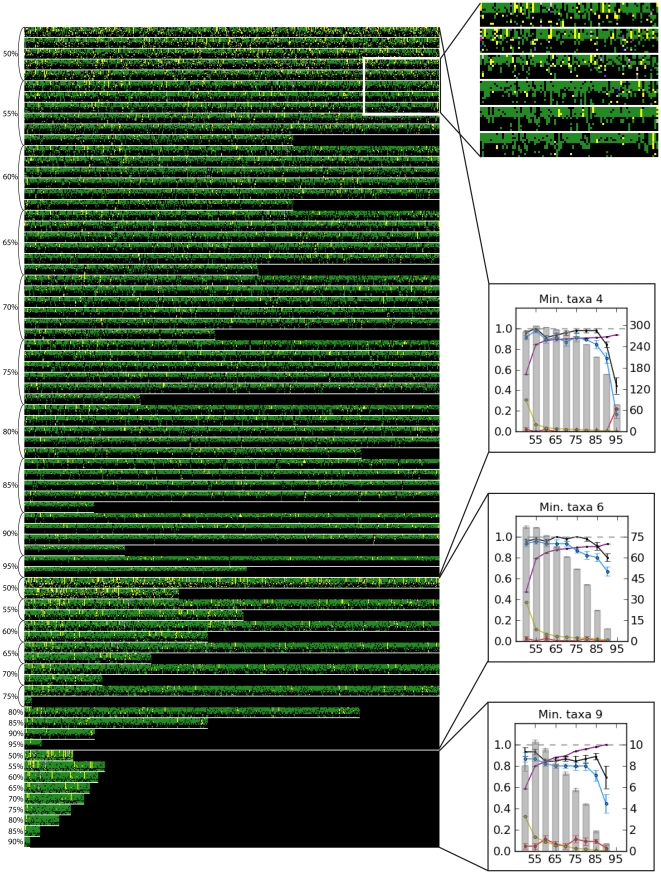
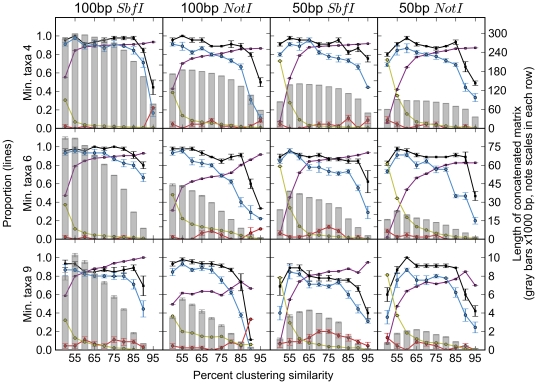
Reduced-representation genome sequencing represents a new source of data for systematics, and its potential utility in interspecific phylogeny reconstruction has not yet been explored. One approach that seems especially promising is the use of inexpensive short-read technologies (e.g., Illumina, SOLiD) to sequence restriction-site associated DNA (RAD)--the regions of the genome that flank the recognition sites of restriction enzymes. In this study, we simulated the collection of RAD sequences from sequenced genomes of different taxa (Drosophila, mammals, and yeasts) and developed a proof-of-concept workflow to test whether informative data could be extracted and used to accurately reconstruct "known" phylogenies of species within each group. The workflow consists of three basic steps: first, sequences are clustered by similarity to estimate orthology; second, clusters are filtered by taxonomic coverage; and third, they are aligned and concatenated for "total evidence" phylogenetic analysis. We evaluated the performance of clustering and filtering parameters by comparing the resulting topologies with well-supported reference trees and we were able to identify conditions under which the reference tree was inferred with high support. For Drosophila, whole genome alignments allowed us to directly evaluate which parameters most consistently recovered orthologous sequences. For the parameter ranges explored, we recovered the best results at the low ends of sequence similarity and taxonomic representation of loci; these generated the largest supermatrices with the highest proportion of missing data. Applications of the method to mammals and yeasts were less successful, which we suggest may be due partly to their much deeper evolutionary divergence times compared to Drosophila (crown ages of approximately 100 and 300 versus 60 Mya, respectively). RAD sequences thus appear to hold promise for reconstructing phylogenetic relationships in younger clades in which sufficient numbers of orthologous restriction sites are retained across species.


Conflict of interest statement

Competing Interests: The authors have declared that no competing interests exist.

Figures

Figure 1
Figure 1. Reference phylogenies of each study group.
All branch lengths are arbitrary and do not indicate evolutionary distance. A) Drosophila phylogeny modified from . The inset shows the two alternative topologies commonly supported by individual gene trees in . B) Reference mammal phylogeny from . C) Reference yeast phylogeny from .
Figure 2
Figure 2. The orthology of one replicate of the 100 bp SbfI Drosophila matrices based on the concatenated alignment (701-299,470 bp) of all 12 genomes after restriction cutting and clustering without prior knowledge of orthology.
Each column of square pixels bounded by white lines represents a single cluster (locus) produced by a given set of parameters. Each row within these clusters represents a single taxon. Therefore, between each pair of horizontal white lines is a grid where rows are taxa and columns are clusters. The order of taxa from top to bottom of each cluster is: D. simulans, D. sechellia, D. melanogaster, D. yakuba, D. erecta, D. ananassae, D. pseudoobscura, D. persimilis, D. willistoni, D. virilis, D. mojavensis, and D. grimshawi. The area in the white box is blown up in the inset to show detail. Within a cluster, black indicates that a taxon did not have a sequence in that cluster. Colors in a cluster represent orthologous sequences. For example, the top right cluster (or last column in the top row) in the expanded portion contains orthologous sequences from D. simulans and D. sechellia (yellow), and orthologous sequences from D. melanogaster, D. yakuba, and D. erecta (green), though sequences from the two groups are not orthologous. The cluster immediately to the left contains orthologous sequences from D.pseudoobscura, D. persimilis, D. mojavensis, and D. grimshawi. The values of similarity used for clustering the sequences in each matrix are indicated on the left and the minimum threshold number of taxa (min. taxa) is indicated by the plots on the right. These plots are exactly as in Fig. 3. Note that many parameter combinations yield matrices that span several lines. The boundaries between matrix representations are indicated on the left.
Figure 3
Figure 3. Accuracy of the RAD method for inferring Drosophila phylogeny.
Proportions are indicated on the left axis. The x-axis shows the percent similarity used for clustering, the three rows show each minimum cluster size, and the read lengths and restriction sites used are indicated by column. Gray bars represent total matrix length as represented on the right axis. Black points are the mean proportion of correct nodes in a tree (out of a total of 9), blue points are the mean proportion of correct nodes with bootstrap support greater than 70%, and red points are the mean proportion of incorrect nodes with bootstrap support greater than 70%. Purple points are the proportion of clusters that are orthologous and yellow points are the proportion of invariant sites within clusters. Results from every set of parameters are shown. Points represent the mean ± SE of the five replicates of clustering, filtering, and tree inference for each set of parameters with randomized input order of sequences into UCLUST. However, not all parameters produced five usable matrices (one or more taxa with all empty sequence). The number of successful replicates is shown in Table S2.

References

    1. Fulton TM, der Hoeven RV, Eannetta NT, Tanksley SD. Identification, analysis, and utilization of conserved ortholog set markers for comparative genomics in higher plants. Plant Cell. 2002;14:1457–1467. - PMC - PubMed
    1. Wu F, Mueller LA, Crouzillat D, Pétiard V, Tanksley SD. Combining bioinformatics and phylogenetics to identify large sets of single-copy orthologous genes (COSII) for comparative, evolutionary and systematic studies: A test case in the Euasterid plant clade. Genetics. 2006;174:1407–1420. - PMC - PubMed
    1. Rokas A, Williams BL, King N, Carrol SB. Genome-scale approaches to resolving incongruence in molecular phylogenies. Nature. 2003;425:798–804. - PubMed
    1. Drosophila 12 Genomes Consortium. Evolution of genes and genomes on the Drosophila phylogeny. Nature. 2007;450:203–218. - PubMed
    1. Foster JT, Beckstrom-Sternberg SM, Pearson T, Beckstrom-Sternberg JS, Chain PSG, et al. Whole-genome-based phylogeny and divergence of the genus Brucella. J Bacteriol. 2009;191:2864–2870. - PMC - PubMed

Publication types

LinkOut - more resources