. 2012;7(4):e33971.
doi: 10.1371/journal.pone.0033971. Epub 2012 Apr 6.

Phylogenetic incongruence in E. coli O104: understanding the evolutionary relationships of emerging pathogens in the face of homologous recombination

Affiliations

Phylogenetic incongruence in E. coli O104: understanding the evolutionary relationships of emerging pathogens in the face of homologous recombination

Weilong Hao et al. PLoS One. 2012.

Abstract

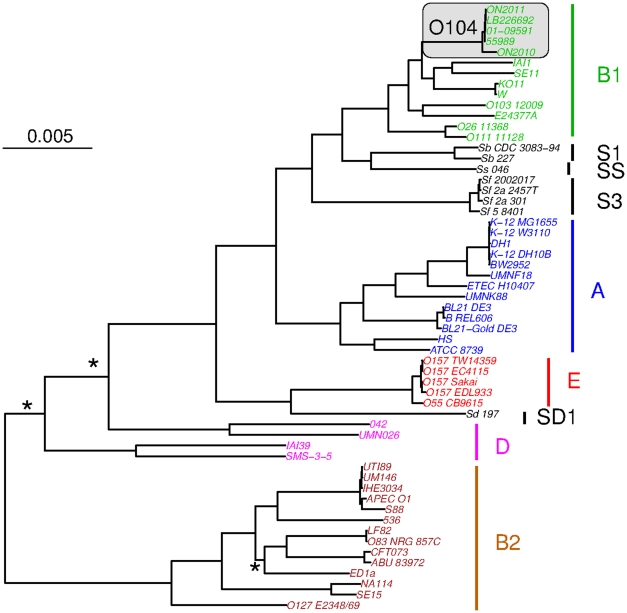
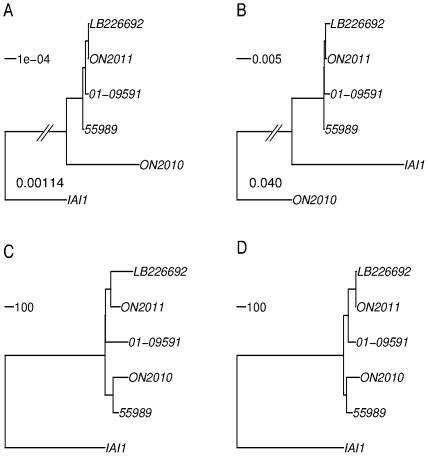
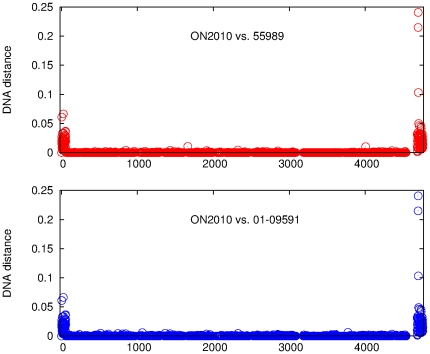
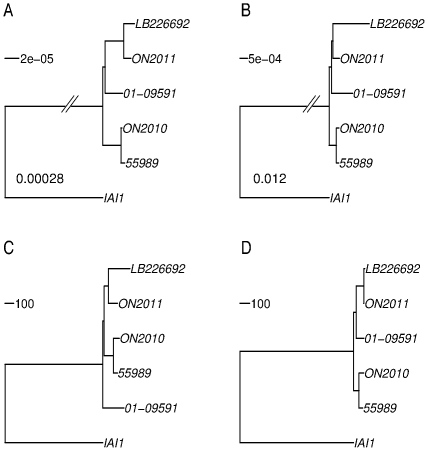
Escherichia coli O104:H4 was identified as an emerging pathogen during the spring and summer of 2011 and was responsible for a widespread outbreak that resulted in the deaths of 50 people and sickened over 4075. Traditional phenotypic and genotypic assays, such as serotyping, pulsed field gel electrophoresis (PFGE), and multilocus sequence typing (MLST), permit identification and classification of bacterial pathogens, but cannot accurately resolve relationships among genotypically similar but pathotypically different isolates. To understand the evolutionary origins of E. coli O104:H4, we sequenced two strains isolated in Ontario, Canada. One was epidemiologically linked to the 2011 outbreak, and the second, unrelated isolate, was obtained in 2010. MLST analysis indicated that both isolates are of the same sequence type (ST678), but whole-genome sequencing revealed differences in chromosomal and plasmid content. Through comprehensive phylogenetic analysis of five O104:H4 ST678 genomes, we identified 167 genes in three gene clusters that have undergone homologous recombination with distantly related E. coli strains. These recombination events have resulted in unexpectedly high sequence diversity within the same sequence type. Failure to recognize or adjust for homologous recombination can result in phylogenetic incongruence. Understanding the extent of homologous recombination among different strains of the same sequence type may explain the pathotypic differences between the ON2010 and ON2011 strains and help shed new light on the emergence of this new pathogen.


Conflict of interest statement

Competing Interests: The authors have declared that no competing interests exist.

Figures

Figure 1
Figure 1. Maximum likelihood phylogenetic tree of the 58 Escherichia and Shigella strains (57 E. coli/Shigella + E. fergusonii) as reconstructed from the sequences of 2085 universally present single-copy genes (1962650 characters in total).
E. fergusonii was chosen to root the tree. Three internal branches that are not well supported (with a bootstrap value <90) are labeled as asterisks. Phylogenetic group membership of the strains is indicated with bars at the right of the figure. The E. coli O104 strains are shaded.
Figure 2
Figure 2. Population clusters of the Escherichia and Shigella strains.
A), all 2085 universally present genes were analyzed. B), universally present recombinant genes were excluded. Proportions of ancestry were inferred using STRUCTURE by assuming four groups (K = 4), and displayed with DISTRUCT . Each column represents one genome, and the genome order is as in Figure 1.
Figure 3
Figure 3. E. coli O104:H4 phylogenies constructed based on the 3794 shared genes using different methodologies.
A), maximum likelihood tree of the concatenated sequences (3613248 characters). All branches are 100% bootstrap supported. The branch length separating IAI1 from the E. coli O104:H4 strains is not to scale and the length is shown. B), feature frequency profiles (FFPs) tree. ON2010 is shown to be distinct from the remaining E. coli O104:H4 strains and IAI1. The branch length separating ON2010 from other strains is not to scale and the length is shown. C), neighbor-joining tree based on the number of alleles that differ between any two strains. D), neighbor-joining tree based on the number of alleles that have none-zero DNA distance between any two strains. Unlike in C, small indels, including possible homopolymer sequencing errors, were not considered in D.
Figure 4
Figure 4. Optical map similarity cluster of the E. coli O104:H4 strains.
De novo whole genome optical maps from the ON2010 and ON2011 strains were generated using the Argus™ optical mapping system with the Ncol restriction enzyme. An in silico genomic map of the 55989 strain was generated in MapSolver™ by applying the Ncol restriction pattern. A close relationship between LB226692 and 01-09591 was reported by Mellmann et al. 2011 using the same restriction enzyme, and the 01-09591 branch is added as dashed.
Figure 5
Figure 5. Genome synteny.
(A) 55989 vs. ON2010; (B) 55989 vs. IAI1. Homologous matches are taken to have an expected value <10−20 for all the 3792 genes shared by IAI1, 55989, 01-09591, ON2010 and ON2011 in a BLASTN search. The x-axis shows the order of genes on the 55989 chromosome. The y-axis shows the nucleotide coordinates of the subject genome.
Figure 6
Figure 6. DNA distance between ON2010 vs. 55989 and between ON2010 vs. 01-09591.
The data are plotted as of the gene order on the 55989 chromosome.
Figure 7
Figure 7. COG functional categories of the 125 genes involved in ON2010-specific recombination.
The functional categories are information storage and processing, including COG categories J, K, L, and B; cellular processes and signaling, including V, T, M, N, U, and O; metabolism, including C, G, E, F, H, I, P, and Q; poorly characterized including R and S; and ‘-’ refers to not in COG.
Figure 8
Figure 8. E. coli O104:H4 phylogenies constructed after the removal of the 125 gene involved in recombination in ON2010.
A), maximum likelihood tree of the concatenated sequences of 3669 genes (3487410 characters). All branches are 100% bootstrap supported. B), feature frequency profiles (FFPs) tree. C), neighbor-joining tree based on the number of alleles that differ between any two strains. D), neighbor-joining tree based on the number of alleles that have none-zero DNA distance between any two strains. Unlike in C, small indels, including homopolymer sequencing errors, were not considered in D.
Figure 9
Figure 9. Sequence alignments of yaaH (A) and EC55989_4986 (B).
Only informative sites are shown with coordinates at the top. Sequences that are identical with the ON2010 sequence are highlighted in light green.
Figure 10
Figure 10. Sequence alignments of the araC gene.
Regions that are identical with the ON2010 sequence are highlighted in light green.
Figure 11
Figure 11. DNA distance between ON2011 vs. 55989 and between ON2011 and 01-09591.
The data are plotted as of the gene order on the 55989 chromosome.

Similar articles

Cited by

References

    1. Ochman H, Lawrence JG, Groisman EA. Lateral gene transfer and the nature of bacterial innovation. Nature. 2000;405:299–304. - PubMed
    1. Dobrindt U, Hacker J. Whole genome plasticity in pathogenic bacteria. Curr Opin Microbiol. 2001;4:550–557. - PubMed
    1. Hacker J, Blum-Oehler G, Muhldorfer I, Tschape H. Pathogenicity islands of virulent bacteria: structure, function and impact on microbial evolution. Mol Microbiol. 1997;23:1089–1097. - PubMed
    1. McGraw EA, Li J, Selander RK, Whittam TS. Molecular evolution and mosaic structure of alpha, beta, and gamma intimins of pathogenic Escherichia coli. Mol Biol Evol. 1999;16:12–22. - PubMed
    1. Posada D, Crandall KA, Holmes EC. Recombination in evolutionary genomics. Annu Rev Genet. 2002;36:75–97. - PubMed

Publication types

MeSH terms

LinkOut - more resources