

Universal sequence replication, reversible polymerization and early functional biopolymers: a model for the initiation of prebiotic sequence evolution
- PMID: 22493682
- PMCID: PMC3320909
- DOI: 10.1371/journal.pone.0034166
Universal sequence replication, reversible polymerization and early functional biopolymers: a model for the initiation of prebiotic sequence evolution
Abstract
Many models for the origin of life have focused on understanding how evolution can drive the refinement of a preexisting enzyme, such as the evolution of efficient replicase activity. Here we present a model for what was, arguably, an even earlier stage of chemical evolution, when polymer sequence diversity was generated and sustained before, and during, the onset of functional selection. The model includes regular environmental cycles (e.g. hydration-dehydration cycles) that drive polymers between times of replication and functional activity, which coincide with times of different monomer and polymer diffusivity. Template-directed replication of informational polymers, which takes place during the dehydration stage of each cycle, is considered to be sequence-independent. New sequences are generated by spontaneous polymer formation, and all sequences compete for a finite monomer resource that is recycled via reversible polymerization. Kinetic Monte Carlo simulations demonstrate that this proposed prebiotic scenario provides a robust mechanism for the exploration of sequence space. Introduction of a polymer sequence with monomer synthetase activity illustrates that functional sequences can become established in a preexisting pool of otherwise non-functional sequences. Functional selection does not dominate system dynamics and sequence diversity remains high, permitting the emergence and spread of more than one functional sequence. It is also observed that polymers spontaneously form clusters in simulations where polymers diffuse more slowly than monomers, a feature that is reminiscent of a previous proposal that the earliest stages of life could have been defined by the collective evolution of a system-wide cooperation of polymer aggregates. Overall, the results presented demonstrate the merits of considering plausible prebiotic polymer chemistries and environments that would have allowed for the rapid turnover of monomer resources and for regularly varying monomer/polymer diffusivities.
Conflict of interest statement
Figures
 ,
,  , and
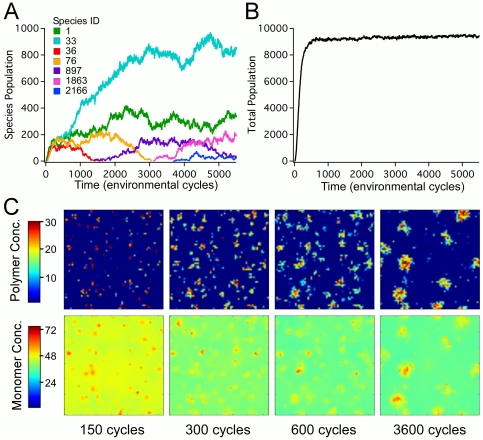
, and  , and polymer and monomer diffusivities are set as
  and
and  sites/cycle, respectively. Units of time are in number of cycles.
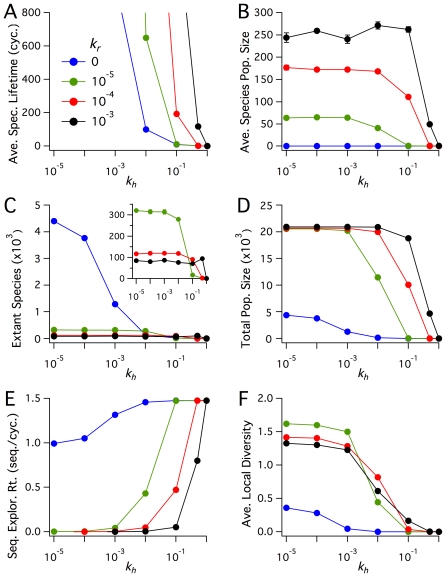
 cycles, and each point is the ensemble average over five realizations. Error bars denote the sample standard deviation (most are smaller than symbols). The rate constant for spontaneous sequence nucleation is
  , and the diffusion rate constants are
  sites/cycle and
  sites/cycle. The blue data set shows the reference case with
  , where no polymers replicate.
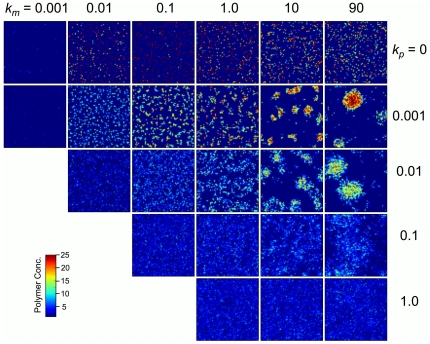
 (in sites/cycle), and each row has a different value for polymer diffusivity
  (in sites/cycle). All data shown are for kinetic rate constants
  ,
,  , and
, and  . All maps correspond to
  cycles. The color scale is in units of polymers/site. Simulations were only run for cases in which monomer diffusivity is greater than or equal to the polymer diffusivity.
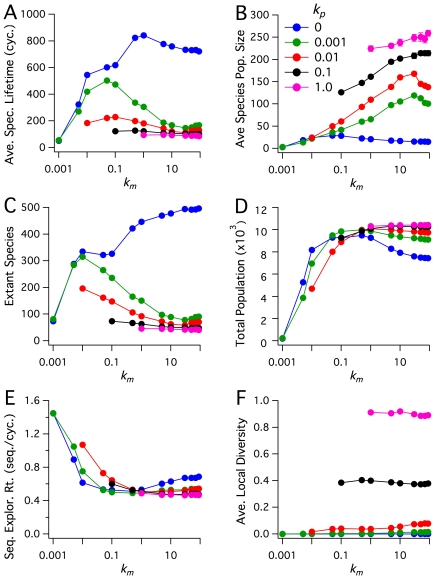
 cycles, and each point is the ensemble average over ten realizations. Error bars denote the sample standard deviation (most are smaller than symbols). The kinetic rate constants are
  ,
,  , and
, and  . The blue data set shows the case where the
  , where polymers are completely immobile.
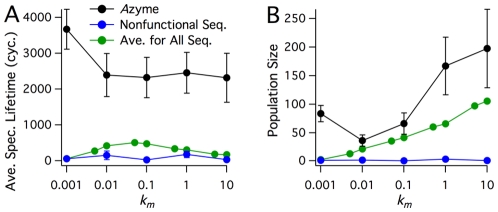
 zyme, compared to nonfunctional sequences. A: Average Species Lifetime (in units of number of cycles), and B: Average Population Size. Each data point is the ensemble average over twenty-five runs, with error bars denoting the sample standard deviation. Kinetic rate constants are
  ,
,  , and
, and  , with a polymer diffusion rate constant of
  sites/cycle. The green points represent overall population statistics for realizations with no
  zyme (plotted in green in Figure 4). The black points represent statistics for a single functional
  zyme. The blue points represent statistics for a nonfunctional sequence introduced at the same location and cycle as in the
  zyme simulations, except with no functionality.
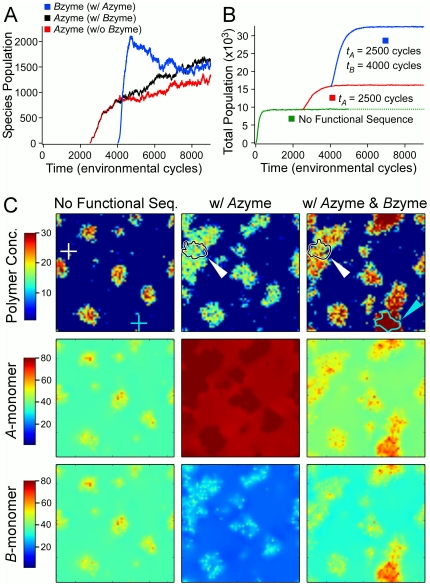
 cycles, at which time the system has achieved a quasi-steady state distribution. In the first scenario, no functional sequences appear. In the second scenario, a functional
  zyme appears at
  = 2500. In the third scenario, the same functional
  zyme appears at
  = 2500, and a functional
  zyme also appears at
  = 4000. A: Time evolution of the Species Populations of the
  zyme and
  zyme. The units of time are in number of cycles. The red curve corresponds to the second scenario, having only the
  zyme, while the black and blue curves correspond to the third scenario with both enzymes emerging. B: The time evolution of the Total Polymer Population for the three scenarios. C: The spatial distribution of the polymer (total) and monomer concentrations, at
  = 5000 cycles. White arrow indicates contour containing
  % of
% of  zyme polymers, cyan arrow indicates contour containing 95% of
  zyme polymers. Kinetic rate constants are
  ,
,  , and
, and  , and diffusive rate constants are
  and
and  sites/cycle.
References
-
- Szathmáry E, Smith JM. The major transitions in evolution. Oxford: Oxford University Press; 1997.
-
- Ellington A, Szostak J. In vitro selection of RNA molecules that bind specific ligands. Nature. 1990;346:818–822. - PubMed
-
- Tuerk C, Gold L. Systematic evolution of ligands by exponential enrichment: RNA ligands to bacteriophage T4 DNA polymerase. Science. 1990;249:505–510. - PubMed
-
- Wochner A, Attwater J, Coulson A, Holliger P. Ribozyme-catalyzed transcription of an active ribozyme. Science. 2011;332:209–212. - PubMed
Publication types
MeSH terms
Substances
LinkOut - more resources
Full Text Sources
