. 2012;7(4):e34499.
doi: 10.1371/journal.pone.0034499. Epub 2012 Apr 6.

The Digital Fish Library: using MRI to digitize, database, and document the morphological diversity of fish

Affiliations

The Digital Fish Library: using MRI to digitize, database, and document the morphological diversity of fish

Rachel M Berquist et al. PLoS One. 2012.

Abstract

Museum fish collections possess a wealth of anatomical and morphological data that are essential for documenting and understanding biodiversity. Obtaining access to specimens for research, however, is not always practical and frequently conflicts with the need to maintain the physical integrity of specimens and the collection as a whole. Non-invasive three-dimensional (3D) digital imaging therefore serves a critical role in facilitating the digitization of these specimens for anatomical and morphological analysis as well as facilitating an efficient method for online storage and sharing of this imaging data. Here we describe the development of the Digital Fish Library (DFL, http://www.digitalfishlibrary.org), an online digital archive of high-resolution, high-contrast, magnetic resonance imaging (MRI) scans of the soft tissue anatomy of an array of fishes preserved in the Marine Vertebrate Collection of Scripps Institution of Oceanography. We have imaged and uploaded MRI data for over 300 marine and freshwater species, developed a data archival and retrieval system with a web-based image analysis and visualization tool, and integrated these into the public DFL website to disseminate data and associated metadata freely over the web. We show that MRI is a rapid and powerful method for accurately depicting the in-situ soft-tissue anatomy of preserved fishes in sufficient detail for large-scale comparative digital morphology. However these 3D volumetric data require a sophisticated computational and archival infrastructure in order to be broadly accessible to researchers and educators.


Conflict of interest statement

Competing Interests: The authors have declared that no competing interests exist.

Figures

Figure 1
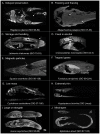
Figure 1. Common problems encountered when scanning museum fishes.
Specimens were prepared for imaging and scanned as described in the Methods. Specific details for each species can be found in the DFL. (A) 3T horizontal image slice (937 µm3 resolution) of an oarfish, Regalecus glesne (SIO 96-82; SL 730 cm) demonstrating the effects of delaying soft tissue preservation. Arrows indicate tissues with significant decomposition. (B) 3T horizontal image slice (1.1 mm3 resolution) of a megamouth shark, Megachasma pelagios (SIO 07-53; standard length (SL) 215 cm) with significant tissue damage (arrows) from repeated freezing and thawing prior to fixation, resulting in poor tissue MRI signal and contrast. The asterisk indicates mechanical damage to the jaw. (C) 3T sagittal image slice (761 µm3 resolution) of a coelacanth, Latimeria chalumnae (SIO 75-347; SL 950 mm) demonstrating poor MRI results from being frozen and thawed prior to fixation and from extensive handling including dissection. (D) 7T sagittal slice (100 µm3 resolution) of a triplespot blenny, Crossosalarias macrospilus (SIO 02-3; SL 73 mm) exhibiting poor imaging results caused by exposure to alcohol without prior formalin fixation. (E) 3T sagittal slice (586 µm3 resolution) of a spiny dogfish, Squalus acanthias (SIO 08-138; SL 740 mm) showing the presence of inorganic particles in the inner ear causing a prominent magnetic susceptibility artefact. (F) 7T sagittal slice (100 µm3 resolution) of a California killifish, Fundulus parvipinnis (SIO 09-224; SL 68 mm) exhibiting a prominent magnetic susceptibility artefact caused by gases trapped in its gut. (G) 7T sagittal and horizontal slices (60 µm3 resolution) of a benttooth bristlemouth, Cyclothone acclinidens (SIO 07-166; SL 53 mm) exhibiting very poor image contrast caused by its extreme low body mass leading to an insufficient signal loading of the RF coil. (H) 7T sagittal and horizontal slices (100 µm3 resolution) of a glass catfish, Kryptopterus bicirrhis (SIO Uncat; SL 45 mm) showing problems with slice plane misalignment associated with scanning very flat or thin-bodied fishes. (I) 3T sagittal and horizontal slices (586 µm3 resolution) of a shortfin mako, Isurus oxyrinchus (SIO 55-85; SL 875 mm) showing slice plane misalignment problems associated with scanning large and/or elongate specimens requiring sequential repositioning of the coil to scan their full length. (I) 7T sagittal and horizontal slices (100 µm3 resolution) of a Pacific hagfish, Eptatretus stoutii (SIO 87-125; SL 145 mm) illustrating slice plane misalignment problems associated with scanning specimens preserved with body positions that cannot be straightened, preventing acquisition of bilaterally symmetrical slices in every plane.
Figure 2
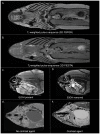
Figure 2. Optimizing preparation and scanning of museum specimens.
(A) Comparison of T1-weighted 3D FSPGR (fast-spoiled gradient-recalled echo) and (B) T2-weighted 3D FIESTA MRI pulse sequences acquired on the 3T scanner (slice matrix = 512×512×236, slice thickness = 900 µm, resolution = 683 µm3, averages = 2) in the smooth hammerhead, Sphyrna lewini (SIO 64-528, SL 104 cm). Additional parameters for the T1-weighted 3D Fast-Spoiled Gradient Echo (FSPGR) pulse sequence include, FA = 35°, TR = 9.86 ms, TE = 4.112 ms, and for the T2-weighted 3D FIESTA pulse sequence, FA = 40°, TR = 4.456 ms, TE = 2.1 ms. (C) The red bream, Beryx decadactylus (SIO 85-77; SL 289 mm), was initially imaged with a T1-weighted FSPGR pulse sequence on the 3T scanner prior to rehydration, and (D) re-imaged following rehydration resulting in an enhanced image quality. Scan parameters: FA = 30°, TR = 11.904 ms, TE = 3.932 ms, slice matrix = 512×512×236, slice thickness = 600 µm, resolution = 527 µm3, averages = 3. (E) The fantail filefish, Pervagor spilosoma (SIO 53-539; SL 74 mm) was initially imaged on the 7T scanner using a T1-weighted FLASH pulse sequence without exposure to contrast agent, ProHance. (F) It was subsequently reimaged following exposure to 2.5 mM ProHance, resulting in a significantly brighter MR signal and enhanced visual contrast among tissues. Scan parameters: FA = 15°, TR = 25.875 ms, TE = 12.853 ms, slice matrix = 350×1000×420, slice thickness = 100 µm, resolution = 100 µm3, averages = 8.
Figure 3
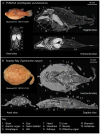
Figure 3. Examples of T1-weighted contrast-enhanced 7T MRI data.
(A) Spotted sharpnose puffer, Canthigaster punctatissima (SIO 61-225, SL 57 mm). Pulse sequence parameters include: FA = 15°, TR = 22.814 ms, TE = 11.322 ms, slice thickness = 100 µm, slice matrix = 354×780×210, resolution = 100 µm3, averages = 5. (B) Blind legged torpedo, Typhlonarke aysoni (SIO 61-149, SL 92 mm). Pulse sequence parameters include: FA = 15°, TR = 23 ms, TE = 11.222 ms, slice thickness = 100 µm, slice matrix = 550×830×180, resolution = 100 µm3, averages = 3. Numbered labels indicate a selection of readily visible anatomical structures in these slices.
Figure 4
Figure 4. DigiFish Viewer with shortfin mako (Isurus oxyrinchus) MRI data.
(A) 2D Slice Viewer displays slices in each orthogonal plane. Distances between points within slices can be measured. (B) 3D Slice Viewer displays an intersecting slice from each orthogonal plane in a single view that can be reoriented in 3D. (C) 3D Volume Viewer displays slice data as a 3D volume. Image contrast can be adjusted which also takes effect in the Slice Viewers. (D) 3D Segmented Structure Viewer displays 3D renderings of segmented structures. In this example, the skin (rendered partially transparent) and a selection of internal organs are shown. The olfactory sacs have been selected from the list of available structures and are highlighted (in white) in the viewer window.
Figure 5
Figure 5. Examples of 3D segmentation and rendering of DFL data.
(A) This damba, Paretroplus damii (AMNH 248081, SL 76 mm) was imaged at 7T with the following 3D FLASH pulse sequence parameters: FA = 15°, TR = 24.07 ms, TE = 11.92 ms, slice thickness = 100 µm, slice matrix = 300×1024×500, resolution = 100 µm3, averages = 2. MRI slice data is overlaid with a selection of segmented soft tissue structures color-coded as follows: light blue = brain and spinal cord; dark blue = eyes; magenta = vestibular labyrinth; green = gas bladder; light brown = alimentary tract; red = heart and dorsal aorta. (B) Both MRI and CT data were acquired for this island kelpfish, Alloclinus holderi (SIO 67-272, SL 94 mm). A selection of soft tissue structures were segmented from MRI data and are color-coded as follows: blue = eyes; green = brain; red = alimentary tract; light brown = ovaries; purple = liver. Segmented soft tissues were co-registered with a volumetric rendering of CT imaged hard tissue structures acquired by The University of Texas High-Resolution X-ray Computed Tomography Facility (UTCT) (slice thickness 42 µm). (C) This smooth hammerhead, Sphyrna zygaena (SIO 64-528; SL 104 mm) was imaged at 3T with the following 3D FSPGR pulse sequence parameters: FA = 35°, TR = 9.86 ms, TE = 4.11 ms, slice thickness = 900 µm, slice matrix = 512×512×236, resolution = 683 µm3, averages = 2. It was scanned in 4 sections and pieced together in Amira for segmentation. A selection of segmented soft tissue structures are color-coded as follows: brown = alimentary tract; dark blue = eyes; green = olfactory system; light blue = brain; magenta = dorsal aorta; puce = liver; red = heart; white = spinal cord.

Similar articles

Cited by

  • Morphology of the Amazonian Teleost Genus Arapaima Using Advanced 3D Imaging.
    Scadeng M, McKenzie C, He W, Bartsch H, Dubowitz DJ, Stec D, St Leger J. Scadeng M, et al. Front Physiol. 2020 Apr 27;11:260. doi: 10.3389/fphys.2020.00260. eCollection 2020. Front Physiol. 2020. PMID: 32395105 Free PMC article.
  • Quantitative assessment of inner ear variation in elasmobranchs.
    Sauer DJ, Radford CA, Mull CG, Yopak KE. Sauer DJ, et al. Sci Rep. 2023 Jul 24;13(1):11939. doi: 10.1038/s41598-023-39151-0. Sci Rep. 2023. PMID: 37488259 Free PMC article.
  • Open data and digital morphology.
    Davies TG, Rahman IA, Lautenschlager S, Cunningham JA, Asher RJ, Barrett PM, Bates KT, Bengtson S, Benson RB, Boyer DM, Braga J, Bright JA, Claessens LP, Cox PG, Dong XP, Evans AR, Falkingham PL, Friedman M, Garwood RJ, Goswami A, Hutchinson JR, Jeffery NS, Johanson Z, Lebrun R, Martínez-Pérez C, Marugán-Lobón J, O'Higgins PM, Metscher B, Orliac M, Rowe TB, Rücklin M, Sánchez-Villagra MR, Shubin NH, Smith SY, Starck JM, Stringer C, Summers AP, Sutton MD, Walsh SA, Weisbecker V, Witmer LM, Wroe S, Yin Z, Rayfield EJ, Donoghue PC. Davies TG, et al. Proc Biol Sci. 2017 Apr 12;284(1852):20170194. doi: 10.1098/rspb.2017.0194. Epub 2017 Apr 12. Proc Biol Sci. 2017. PMID: 28404779 Free PMC article. Review.
  • Micro-computed tomography: Introducing new dimensions to taxonomy.
    Faulwetter S, Vasileiadou A, Kouratoras M, Thanos Dailianis, Arvanitidis C. Faulwetter S, et al. Zookeys. 2013 Feb 4;(263):1-45. doi: 10.3897/zookeys.263.4261. Print 2013. Zookeys. 2013. PMID: 23653515 Free PMC article.
  • Fish in focus: Navigating organ damage assessment through analytical avenues - A comprehensive review.
    Jerald I, Ravindran J, Babu MM. Jerald I, et al. Toxicol Rep. 2024 Nov 28;13:101841. doi: 10.1016/j.toxrep.2024.101841. eCollection 2024 Dec. Toxicol Rep. 2024. PMID: 39717851 Free PMC article. Review.

References

    1. Suarez AV, Tsutsui ND. The value of museum collections for research and society. Bioscience. 2004;54:66–74. doi: 10.1641/0006-3568(2004)054[0066:tvomcf]2.0.co;2. - DOI
    1. Thacker PD. Morphology: The shape of things to come. Bioscience. 2003;53:544–549. doi: 10.1641/0006-3568(2003)053[0544:mtsott]2.0.co;2. - DOI
    1. Winston JE. Archives of a small planet: The significance of museum collections and museum-based research in invertebrate taxonomy. Zootaxa. 2007;1668:47–54.
    1. Giribet G. A new dimension in combining data? The use of morphology and phylogenomic data in metazoan systematics. Acta Zool. 2010;91:11–19. doi: 10.1111/j.1463-6395.2009.00420.x. - DOI
    1. Ziegler A, Ogurreck M, Steinke T, Beckmann F, Prohaska S, et al. Opportunities and challenges for digital morphology. Biol Direct. 2010;5:45. doi: 10.1186/1745-6150-5-45. - DOI - PMC - PubMed

Publication types

MeSH terms