. 2012;7(4):e34513.
doi: 10.1371/journal.pone.0034513. Epub 2012 Apr 6.

DNA methylation analysis of bone marrow cells at diagnosis of acute lymphoblastic leukemia and at remission

Affiliations

DNA methylation analysis of bone marrow cells at diagnosis of acute lymphoblastic leukemia and at remission

Jessica Nordlund et al. PLoS One. 2012.

Abstract

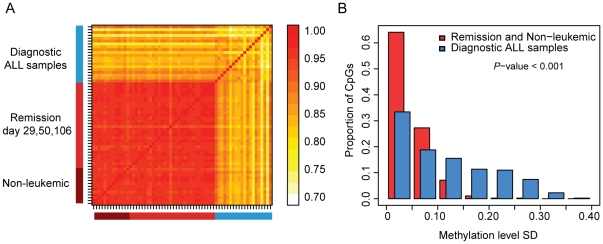
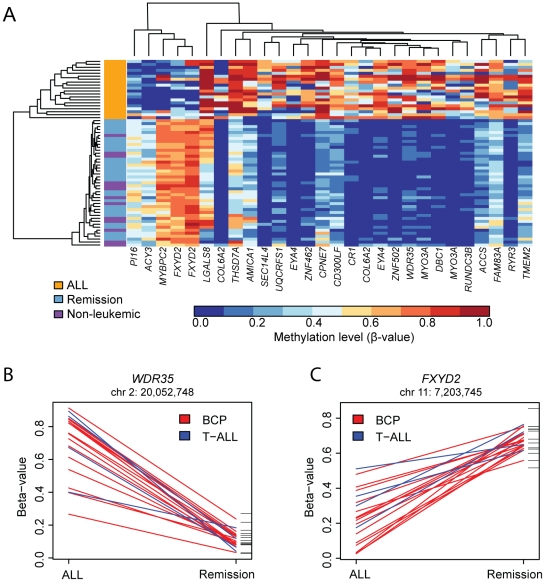
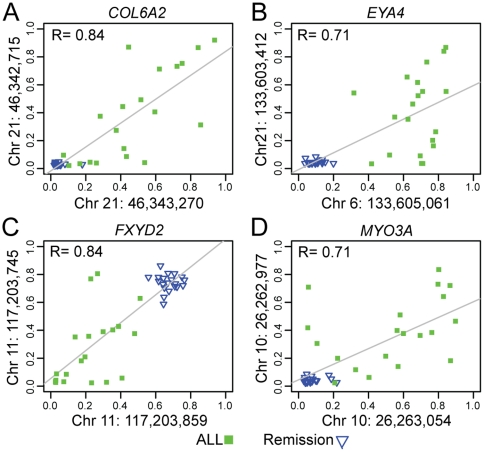
To detect genes with CpG sites that display methylation patterns that are characteristic of acute lymphoblastic leukemia (ALL) cells, we compared the methylation patterns of cells taken at diagnosis from 20 patients with pediatric ALL to the methylation patterns in mononuclear cells from bone marrow of the same patients during remission and in non-leukemic control cells from bone marrow or blood. Using a custom-designed assay, we measured the methylation levels of 1,320 CpG sites in regulatory regions of 413 genes that were analyzed because they display allele-specific gene expression (ASE) in ALL cells. The rationale for our selection of CpG sites was that ASE could be the result of allele-specific methylation in the promoter regions of the genes. We found that the ALL cells had methylation profiles that allowed distinction between ALL cells and control cells. Using stringent criteria for calling differential methylation, we identified 28 CpG sites in 24 genes with recurrent differences in their methylation levels between ALL cells and control cells. Twenty of the differentially methylated genes were hypermethylated in the ALL cells, and as many as nine of them (AMICA1, CPNE7, CR1, DBC1, EYA4, LGALS8, RYR3, UQCRFS1, WDR35) have functions in cell signaling and/or apoptosis. The methylation levels of a subset of the genes were consistent with an inverse relationship with the mRNA expression levels in a large number of ALL cells from published data sets, supporting a potential biological effect of the methylation signatures and their application for diagnostic purposes.


Conflict of interest statement

Competing Interests: The authors have declared that no competing interests exist.

Figures

Figure 1
Figure 1. Correlation matrix and variability of the methylation levels measured at 1,320 CpG sites across the 63 samples included in the study.
(A) Each individual sample is indicated by a black line on the axes. The methylation levels in the samples taken at remission during induction therapy at day 29 and during consolidation therapy at days 50 and 106 are highly correlated with the methylation levels in the non-leukemic samples (median Pearson's correlation coefficient (R) = 0.96), while the diagnostic ALL samples are less similar both to each other and to the samples taken after treatment, and to the non-leukemic samples (median R = 0.83). The scale for the correlation coefficients is shown to the right of the matrix. The red color indicates higher correlation (greater similarity), while the light yellow indicates less correlation (less similarity). (B) Histograms of the standard deviations (SD) for the methylation levels measured for 1,320 CpG sites across 20 ALL samples (blue) and across the combined 33 remission samples and 13 non-leukemic controls (red). SD bins are shown on the horizontal axis. The vertical bars show the proportion of observations in each SD bin. The CpG sites show greater variability in the ALL samples than in the remission samples and non-leukemic controls (Wilcoxon Rank-Sum P<0.001).
Figure 2
Figure 2. Differential methylation in ALL cells.
(A) Heatmap of the methylation profiles of the 28 CpG sites that are differentially methylated between the diagnostic ALL samples, bone marrow cells at remission and non-leukemic bone marrow cells. The ALL samples (orange) and bone marrow cells during remission (blue) form two distinct groups. Thirteen bone marrow cell samples from non-leukemic controls (purple) cluster among the samples collected during remission. The scale for the methylation β-values is shown below the heatmap. The elongated heights of the dendrogram branches between the ALL samples compared to the normal samples illustrate the increased variability in the ALL samples for the 28 CpG sites. Graphs showing the differences in methylation level between CpG sites in the (B) WDR35 and (C) FXYD2 genes at the time of diagnosis (left vertical axis) and during remission (right vertical axis). The data points for each paired sample are connected with a red line for B-cell precursor (BCP) samples and with a blue line for T-ALL samples. The corresponding CpG methylation levels in 13 non-leukemic control samples are shown as black horizontal lines to the right of the graphs. The CpG site at chr2:20,052,748 in the WDR35 gene (B) was hypermethylated in diagnostic ALL samples and hypomethylated at remission and in non-leukemic controls, while the CpG site at chr11:7,203,745 in the FXYD2 gene (C) displayed the opposite pattern. The BCP and T-ALL samples display the same pattern of methylation difference in these two genes.
Figure 3
Figure 3. Correlation between the methylation levels (β-values) of two CpG sites located in the COL6A2, EYA4, FXYD2 and MYO3A genes.
The Pearson's correlation coefficients (R) across the 20 acute lymphoblastic leukemia (ALL) samples taken at ALL diagnosis (green) and the 20 matched bone marrow samples taken at remission (blue) for the four genes are shown in panels A–D. The positions of the CpG sites for which the β-values are plotted are indicated on the axes in each panel (Human Genome Build 36). The inter-individual variation between the pairs of CpG sites in the remission cells is consistently lower than between the ALL cells, which speaks against the variation in ALL cells arising because of methodological factors.

References

    1. Pui CH, Carroll WL, Meshinchi S, Arceci RJ. Biology, risk stratification, and therapy of pediatric acute leukemias: an update. J Clin Oncol. 2011;29:551–565. - PMC - PubMed
    1. Pui CH, Relling MV, Downing JR. Acute lymphoblastic leukemia. N Engl J Med. 2004;350:1535–1548. - PubMed
    1. Jaenisch R, Bird A. Epigenetic regulation of gene expression: how the genome integrates intrinsic and environmental signals. Nat Genet. 2003;33(Suppl):245–254. - PubMed
    1. Milani L, Lundmark A, Nordlund J, Kiialainen A, Flaegstad T, et al. Allele-specific gene expression patterns in primary leukemic cells reveal regulation of gene expression by CpG site methylation. Genome Res. 2009;19:1–11. - PMC - PubMed
    1. Broske A-M, Vockentanz L, Kharazi S, Huska MR, Mancini E, et al. DNA methylation protects hematopoietic stem cell multipotency from myeloerythroid restriction. Nat Genet. 2009;41:1207–1215. - PubMed

Publication types

MeSH terms