. 2012;7(4):e34602.
doi: 10.1371/journal.pone.0034602. Epub 2012 Apr 6.

Suppressive effects on the immune response and protective immunity to a JEV DNA vaccine by co-administration of a GM-CSF-expressing plasmid in mice

Affiliations

Suppressive effects on the immune response and protective immunity to a JEV DNA vaccine by co-administration of a GM-CSF-expressing plasmid in mice

Hui Chen et al. PLoS One. 2012.

Abstract

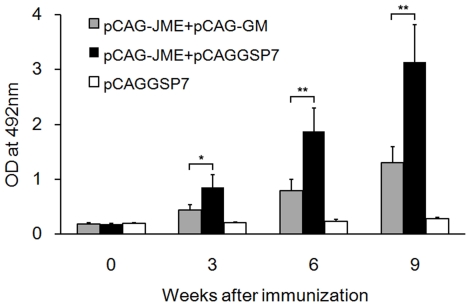
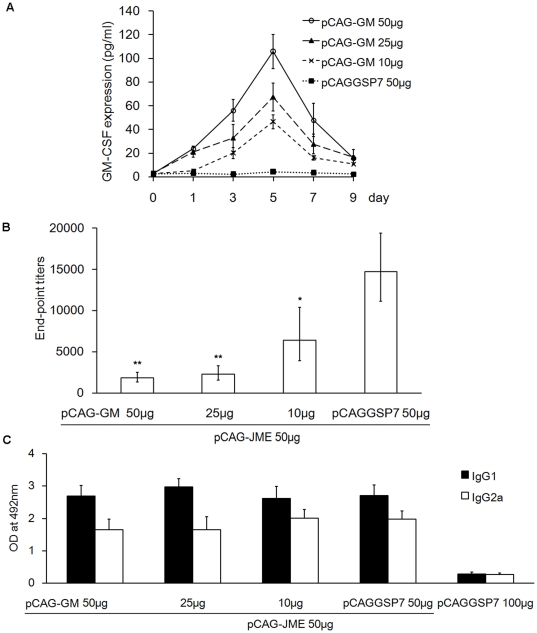
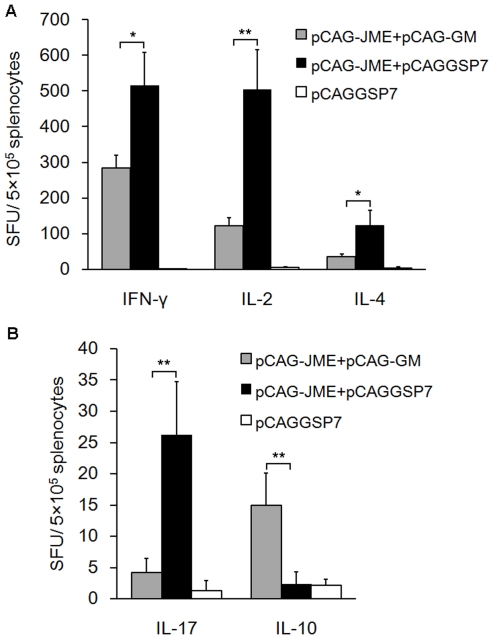
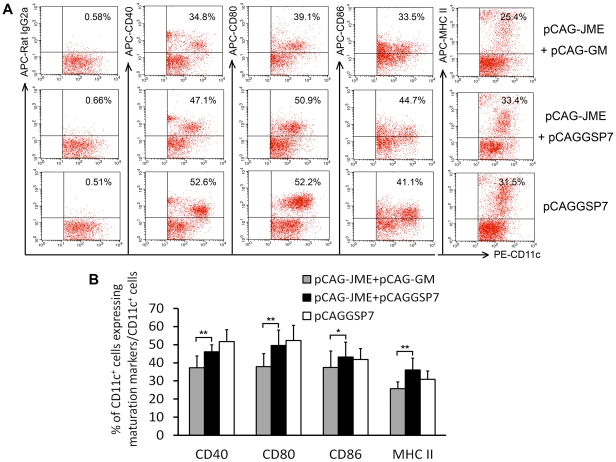
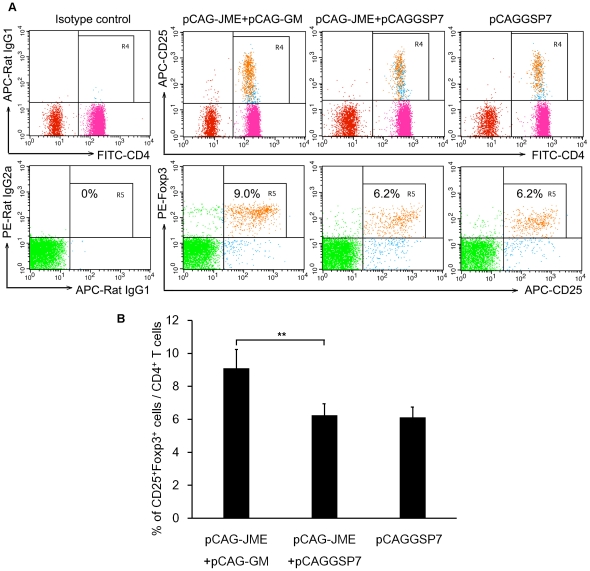
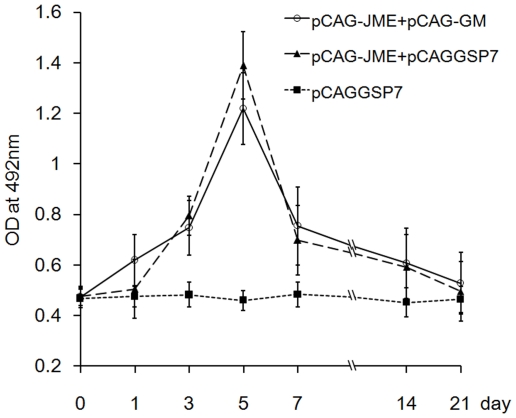
As a potential cytokine adjuvant of DNA vaccines, granulocyte-macrophage colony-stimulating factor (GM-CSF) has received considerable attention due to its essential role in the recruitment of antigen-presenting cells, differentiation and maturation of dendritic cells. However, in our recent study of a Japanese encephalitis virus (JEV) DNA vaccine, co-inoculation of a GM-CSF plasmid dramatically suppressed the specific IgG response and resulted in decreased protection against JEV challenge. It is known that GM-CSF has been used in clinic to treat neutropenia for repopulating myeloid cells, and as an adjuvant in vaccine studies; it has shown various effects on the immune response. Therefore, in this study, we characterized the suppressive effects on the immune response to a JEV DNA vaccine by the co-administration of the GM-CSF-expressing plasmid and clarified the underlying mechanisms of the suppression in mice. Our results demonstrated that co-immunization with GM-CSF caused a substantial dampening of the vaccine-induced antibody responses. The suppressive effect was dose- and timing-dependent and likely related to the immunogenicity of the antigen. The suppression was associated with the induction of immature dendritic cells and the expansion of regulatory T cells but not myeloid-derived suppressor cells. Collectively, our findings not only provide valuable information for the application of GM-CSF in clinic and using as a vaccine adjuvant but also offer further insight into the understanding of the complex roles of GM-CSF.


Conflict of interest statement

Competing Interests: The authors have declared that no competing interests exist.

Figures

Figure 1
Figure 1. Dynamics of the Ab response of JEV DNA-immunized mice were detected by ELISA.
Booster administrations were performed at week 3 and 6. Pre- and post-immunization serum samples (n = 10, 1∶800) were collected and then Ab titers were determined. The bar graph shows the mean ± standard deviation (SD) values for optical density (OD) of the group vaccinated with plasmids: gray-colored bars, mice co-inoculated with 50 µg pCAG-JME and 50 µg pCAG-GM; black bars, mice inoculated with a mixture of 50 µg pCAG-JME and 50 µg pCAGGSP7; hollow bars, mice inoculated with 100 µg pCAGGSP7 empty vector alone (*, p<0.05; **, p<0.01, one-way ANOVA test).
Figure 2
Figure 2. Co-inoculation of GM-CSF plasmid showed the influence on the vaccine-induced Ab responses.
Sera were collected from immunized mice (n = 5) three weeks after the final vaccination. The end-point titers of anti-prM-E Abs were measured by ELISA and recorded as geometrical mean titers (GMT). Gray bars, mice co-inoculated with 50 µg pCAG-GM and 50 µg pCAG-JME (JEV), pCAG-D1ME (DENV1), pCAG-D2ME (DENV2), pCAG-HCV-C (HCV-C) or pCAG-HCV-E1 (HCV-E1); hollow bars, mice inoculated with a mixture of 50 µg pCAG-JME, pCAG-D1ME, pCAG-D2ME and 50 µg pCAGGSP7 (*, p<0.05; **, p<0.01, t test).
Figure 3
Figure 3. JEV-infected Vero cells reacted with DNA-immunized mice sera and visualized by IFA.
Mice sera were obtained three weeks after the final immunization. (A) Serum from mouse immunized with pCAG-JME+pCAGGSP7. (B) Mouse anti-JEV E glycoprotein mAb as a positive control. (C) Serum from mouse immunized with pCAG-JME+pCAG-GM. (D) Serum from mouse immunized with pCAGGSP7. The figures shown are representative of five independent experiments performed. The scale bar is 50 µm.
Figure 4
Figure 4. Mouse-specific serum IgG subclass responses to JEV DNA immunization were determined by ELISA.
Sera (1∶200) were collected from vaccinated mice (n = 10) three weeks post-immunization. Values reported above for each group are the mean ± SD of the OD at 492 nm. The solid bars represent the IgG1 subtype, and the hollow bars represent the IgG2a subtype. The IgG2a/IgG1 ratios of three groups are 0.613±0.045, 0.734±0.057 and 0.954±0.062, respectively.
Figure 5
Figure 5. Protective immunity elicited by JEV-prM-E DNA vaccines.
Mice (n = 8) were challenged with a dose of 50 LD50 of JEV (Beijing-1) three weeks post-immunization followed by daily monitoring for 21 days, and the percentage of survivors was calculated (p<0.05, pCAG-JME+pCAG-GM group vs. pCAG-JME+pCAGGSP7 group, log-rank test).
Figure 6
Figure 6. The suppression of Ab responses by the GM-CSF plasmid was dose-dependent.
(A) Mice (n = 5) were inoculated with various dosages of pCAG-GM (10, 25 and 50 µg) or pCAGGSP7 (50 µg) without booster and the expression levels of GM-CSF in the undiluted sera were monitored by ELISA at pre-inoculation and 1, 3, 5, 7 and 9 day(s) post-inoculation. The expression levels of GM-CSF are shown as the mean concentration with a SD (p<0.01, one-way ANOVA test). (B, C) Mice (n = 5) were immunized with pCAG-JME (50 µg) plus various doses of pCAG-GM (10, 25 and 50 µg) or pCAGGSP7 (50 µg) three times at three-week intervals. Mice treated with 100 µg pCAGGSP7 served as the control. Three weeks after the final immunization, serum samples were collected and the Ab immune response was detected by ELISA. The levels of specific anti-JEV-prME Abs are shown as GMT (*, p<0.05; **, p<0.01, vs. pCAG-JME 50 µg+pCAGGSP7 50 µg group, one-way ANOVA test) (B). The levels of JEV-specific serum (1∶200) IgG subclasses are shown as the OD value (C), and the solid bars represent the IgG1 subtype, the hollow bars represent the IgG2a subtype. The IgG2a/IgG1 ratios of five groups are 0.613±0.045, 0.554±0.041, 0.765±0.055, 0.734±0.057 and 0.954±0.062, in turn.
Figure 7
Figure 7. The suppressive effect of the GM-CSF plasmid on Ab responses was timing-dependent.
Mice (n = 5) were vaccinated with 50 µg pCAG-JME with 50 µg pCAG-GM or pCAGGSP7. The numbers beneath the x-axis indicate the timing of immunization. The 0 indicates that the GM-CSF plasmid was given with pCAG-JME simultaneously, −3 or −1 indicates that the plasmid was given 3 days or 1 day ahead of pCAG-JME delivery, respectively, and 1 indicates that pCAG-GM was given 1 day after pCAG-JME vaccination. Mice treated with 100 µg pCAGGSP7 served as the control. All animals received two booster doses at three-week intervals. Three weeks after the final immunization, serum samples were collected and the Ab immune response was detected by ELISA. The levels of specific anti-JEV-prME Abs are shown as GMT (A). (*, p<0.05; **, p<0.01, vs. pCAG-JME 50 µg+pCAGGSP7 50 µg group, one-way ANOVA test). The levels of JEV-specific serum (1∶200) IgG subclasses are shown as the OD value (B), and the solid bars represent the IgG1 subtype, the hollow bars represent the IgG2a subtype (*, p<0.05; **, p<0.01, vs. 0d, 1d or pCAGGSP7 50 µg groups; one-way ANOVA test). The IgG2a/IgG1 ratios of these six groups are 1.509±0.141, 1.094±0.099, 0.613±0.045, 0.662±0.065, 0.734±0.057 and 0.954±0.062, in turn.
Figure 8
Figure 8. Analysis of the effect of pCAG-GM on splenocyte-secreted cytokines.
Splenocytes were isolated from mice (n = 6) three weeks after the final immunization. The levels of cell-produced IFN-γ, IL-2 and IL-4 (A), IL-17 and IL-10 (B) following stimulation by concentrated JEV proteins for 48 h were measured by ELISPOT assays. The numbers of cytokine-positive cells are expressed as spot-forming units (SFU)/5×105 cells after background subtraction (*, p<0.05; **, p<0.01, one-way ANOVA test).
Figure 9
Figure 9. Analysis of the suppressive effect of pCAG-GM on DC maturation.
100 µl peripheral blood from immunized mice (n = 6) was stained with fluorescently conjugated mouse mAb to detect the expression of the surface markers CD11c, CD40, CD80, CD83 and MHC II on DCs. (A) Representative data from the FACS analysis of peripheral blood DCs from the immunized mice on the 8th day after the final vaccination. The percentage of double-positive cells is indicated in the top of right corner. (B) The bar graph shows the mean percentage with a SD of CD11c+ cells expressing maturation markers in different groups (*, p<0.05; **, p<0.01; one-way ANOVA test).
Figure 10
Figure 10. Analysis of the amplifying effect of pCAG-GM on Tregs.
100 µl peripheral blood from immunized mice (n = 6) was stained with fluorescently conjugated mouse mAbs to detect the surface expression of CD3e, CD4 and CD25 and the intracellular expression of Foxp3. (A) Representative data from the FACS analysis of peripheral blood CD4+CD25+Foxp3+ Tregs from the immunized mice three weeks after the final vaccination. The percentage of double-positive cells is indicated in the top of right corner. (B) The bar graph shows the mean percentage with a SD of CD4+CD25+ Foxp3+ Tregs among CD4+ T cells in different groups (**, p<0.01, one-way ANOVA test).
Figure 11
Figure 11. Kinetics of the expression of the JEV DNA vaccine immunogen.
Mice (n = 5) were immunized with plasmids without booster. JEV prM-E protein expression was measured by ELISA in the undiluted sera collected at pre-inoculation and 1, 3, 5, 7, 14 and 21 days post-inoculation. Data are expressed as the mean values of OD with a SD.

References

    1. Kaufman HL, Flanagan K, Lee CSD, Perretta DJ, Horig H. Insertion of interleukin-2 (IL-2) and interleukin-12 (IL-12) genes into vaccinia virus results in effective anti-tumor responses without toxicity. Vaccine. 2002;20:1862–1869. - PubMed
    1. Chakrabarti R, Chang Y, Song K, Prud'homme GJ. Plasmids encoding membrane-bound IL-4 or IL-12 strongly costimulate DNA vaccination against carcinoembryonic antigen (CEA). Vaccine. 2004;22:1199–1205. - PubMed
    1. Abaitua F, Rodríguez JR, Garzóna A, Rodrígueza D, Esteban M. Improving recombinant MVA immune responses: potentiation of the immune responses to HIV-1 with MVA and DNA vectors expressing Env and the cytokines IL-12 and IFN-gamma. Virus Res. 2006;116:11–20. - PubMed
    1. Nimal S, Heath AW, Thomas MS. Enhancement of immune responses to an HIV gp120 DNA vaccine by fusion to TNF alpha cDNA. Vaccine. 2006;24:3298–3308. - PubMed
    1. Zhang X, Divangahi M, Ngai P, Santosuosso M, Millar J, et al. Intramuscular immunization with a monogenic plasmid DNA tuberculosis vaccine: Enhanced immunogenicity by electroporation and co-expression of GM-CSF transgene. Vaccine. 2007;25:1342–1352. - PubMed

Publication types

MeSH terms