. 2012;7(4):e34647.
doi: 10.1371/journal.pone.0034647. Epub 2012 Apr 6.

Salvianolic acid B prevents bone loss in prednisone-treated rats through stimulation of osteogenesis and bone marrow angiogenesis

Affiliations

Salvianolic acid B prevents bone loss in prednisone-treated rats through stimulation of osteogenesis and bone marrow angiogenesis

Liao Cui et al. PLoS One. 2012.

Abstract

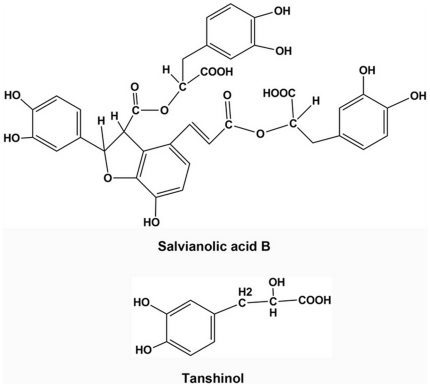
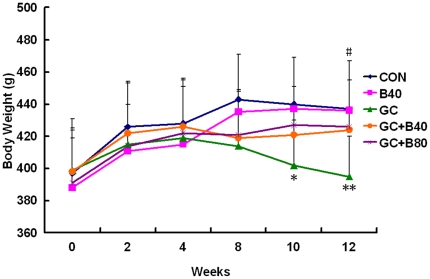
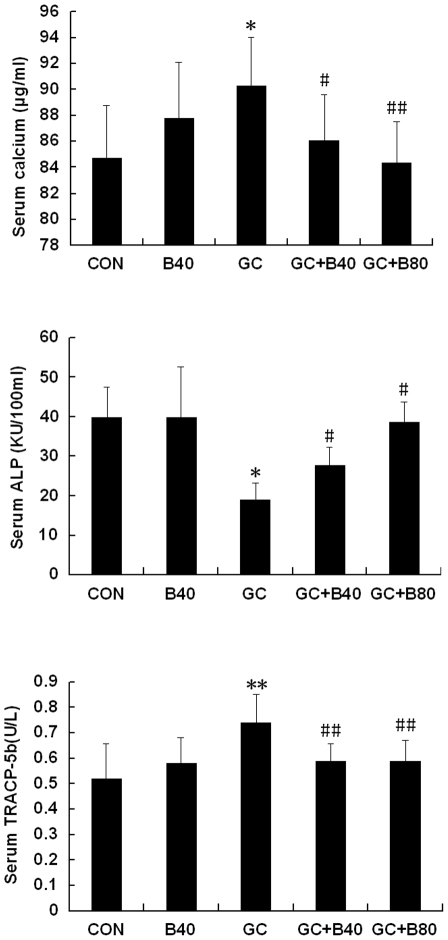
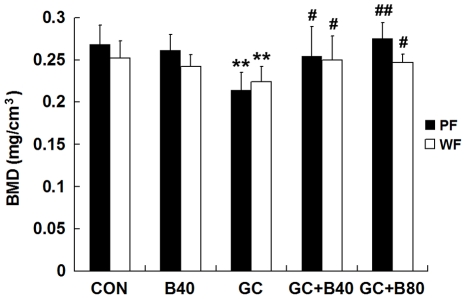
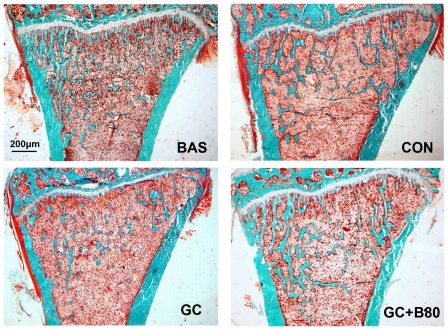
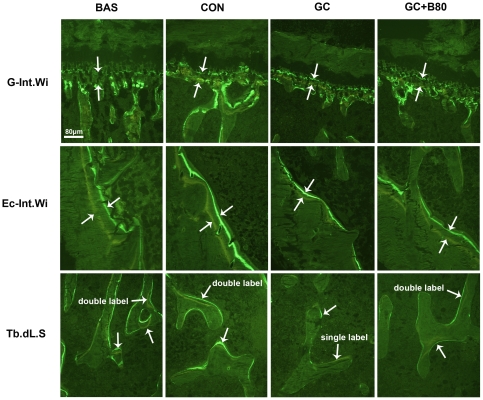
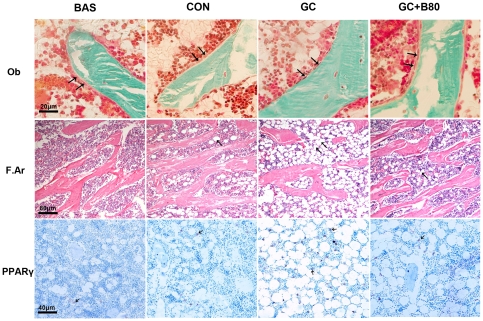
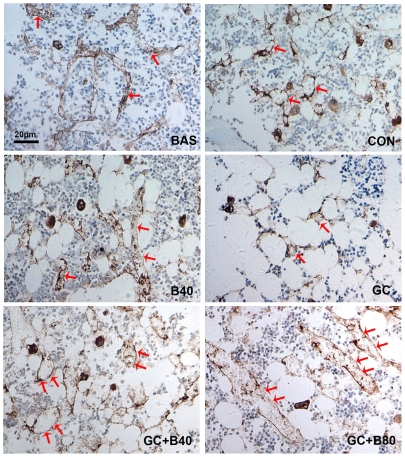
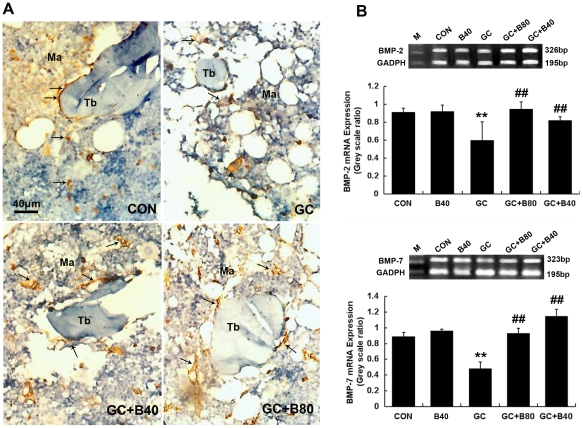
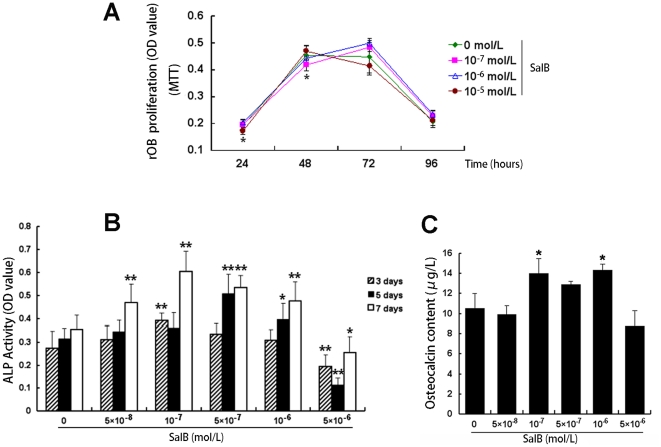
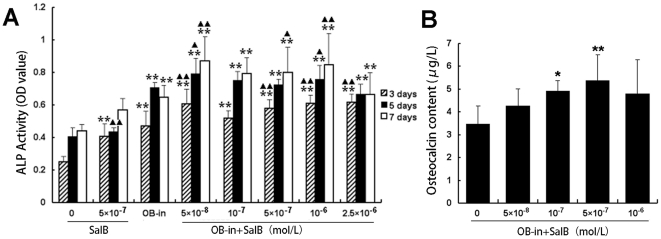
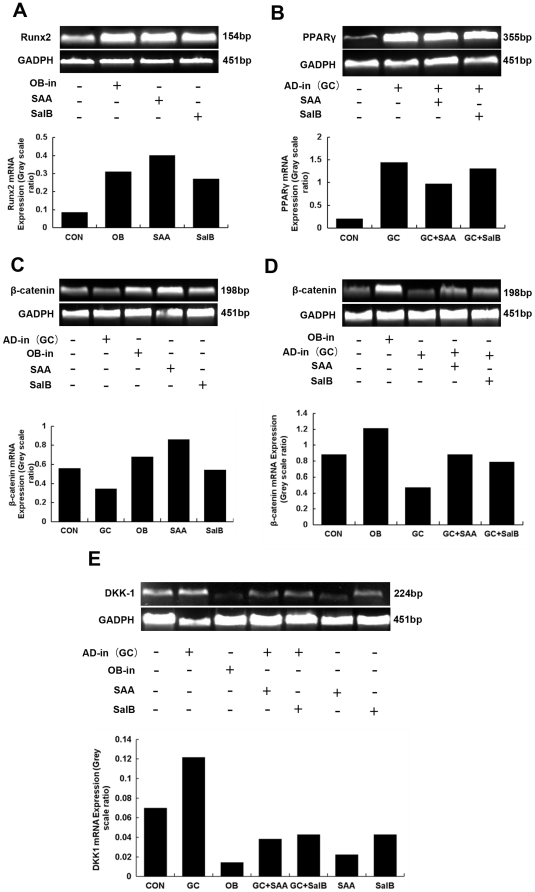
Glucocorticoid (GC) induced osteoporosis (GIO) is caused by the long-term use of GC for treatment of autoimmune and inflammatory diseases. The GC related disruption of bone marrow microcirculation and increased adipogenesis contribute to GIO development. However, neither currently available anti-osteoporosis agent is completely addressed to microcirculation and bone marrow adipogenesis. Salvianolic acid B (Sal B) is a polyphenolic compound from a Chinese herbal medicine, Salvia miltiorrhiza Bunge. The aim of this study was to determine the effects of Sal B on osteoblast bone formation, angiogenesis and adipogenesis-associated GIO by performing marrow adipogenesis and microcirculation dilation and bone histomorphometry analyses. (1) In vivo study: Bone loss in GC treated rats was confirmed by significantly decreased BMD, bone strength, cancellous bone mass and architecture, osteoblast distribution, bone formation, marrow microvessel density and diameter along with down-regulation of marrow BMPs expression and increased adipogenesis. Daily treatment with Sal B (40 mg/kg/d) for 12 weeks in GC male rats prevented GC-induced cancellous bone loss and increased adipogenesis while increasing cancellous bone formation rate with improved local microcirculation by capillary dilation. Treatment with Sal B at a higher dose (80 mg/kg/d) not only prevented GC-induced osteopenia, but also increased cancellous bone mass and thickness, associated with increase of marrow BMPs expression, inhibited adipogenesis and further increased microvessel diameters. (2) In vitro study: In concentration from 10(-6) mol/L to 10(-7) mol/L, Sal B stimulated bone marrow stromal cell (MSC) differentiation to osteoblast and increased osteoblast activities, decreased GC associated adipogenic differentiation by down-regulation of PPARγ mRNA expression, increased Runx2 mRNA expression without osteoblast inducement, and, furthermore, Sal B decreased Dickkopf-1 and increased β-catenin mRNA expression with or without adipocyte inducement in MSC. We conclude that Sal B prevented bone loss in GC-treated rats through stimulation of osteogenesis, bone marrow angiogenesis and inhibition of adipogenesis.


Conflict of interest statement

Competing Interests: The authors have declared that no competing interests exist.

Figures

Figure 1
Figure 1. Structure of Salvianolic acid B and Tanshinol.
Salvianolic acid B consists of three molecules of Tanshinol (D (+) β-3,4-dihydroxyphenyl lactic acid, danshensu) and a molecule of caffeic acid. Sal B can be converted in vivo to Tanshinol, another water-soluble bioactive ingredient of Salvia miltiorrhiza Bunge, with similar function to Sal B.
Figure 2
Figure 2. The HPLC analysis of control compounds (A) and aqueous extraction sample (B) showing the retention time of Tanshinol –Na (1) and Salvianolic acid B (2).
Figure 3
Figure 3. Body weight (g) changes during the experimental period.
Body weight measurements from vehicle (aging) control (CON), Sal B40 mg/kg/d alone (B40), prednisone alone (GC), GC plus 40 mg Sal B/kg/d (GC+B40) and GC plus 80 mg Sal B/kg/d (GC+B80) treated rats. Only the GC treated rats showed a significant 10% lower body weight versus CON. Significant weight loss began at 10 weeks post treatment. *P<0.05, ** P<0.01 vs CON; # P<0.05, ## P<0.01 vs GC.
Figure 4
Figure 4. Biomarker changes in the blood.
Serum calcium (Ca, µg/ml), alkaline phosphatase (ALP, KU/100 ml) and tartrate-resistant acid phosphatase-5b (TRACP-5b, U/L) from vehicle (aging) control (CON), Sal B40 mg/kg/d alone (B40), prednisone alone (GC), GC plus 40 mg Sal B/kg/d (GC+B40) and GC plus 80 mg Sal B/kg/d (GC+B80) treated rats. The GC treatment significantly increased serum calcium and TRACP-5b and reduced ALP, while the Sal B significantly inhibited these GC induced changes. Value are mean ± SD, *P<0.05, ** P<0.01 vs CON; # P<0.05, # # P<0.01 vs GC.
Figure 5
Figure 5. Effects of different groups on Bone Mineral Density (BMD, mg/cm).
BMD measurements of proximal femur (PF) and whole femur (WF) from vehicle (aging) control (CON), Sal B40 mg/kg/d alone (B40), prednisone alone (GC), GC plus 40 mg Sal B/kg/d (GC+B40) and GC plus 80 mg Sal B/kg/d (GC+B80) treated rats. GC treatment significantly reduced BMD at both sites, while Sal B prevented this reduction in GC treated rats. Value are mean ± SD, *P<0.05, ** P<0.01 vs CON; # P<0.05, # # P<0.01 vs GC.
Figure 6
Figure 6. Effects of different treatments on proximal tibial metaphyses (PTM) bone structure and trabecular mass.
Representative micrographs of PTM from basal (BAS), vehicle (aging) control (CON), prednisone (GC) and GC plus 80 mg Sal B/kg/d (GC+B80) treated rats. BAS: 6-month-old beginning control. CON: 9-month-old terminal vehicle control with fewer trabeculae. GC: Prednisone induced further reduction in cancellous bone mass and thinner trabeculae versus CON. GC+B80: Sal B80 treated GC rats had increased cancellous bone mass with thicker trabeculae compared to BAS and CON. (Masson-Goldner Trichrome stain: trabecular in green stain). Quantitative measurements of static parameters are shown in table 6.
Figure 7
Figure 7. Effects of different treatments on Proximal tibial cartilage growth and mineral bone formation.
Representative fluorescence micrographs of interlabel width in the growth plate (G-Int.Wi), interlabel width in the endocortical (Ec-Int.Wi) and double labeling in trabecular surface (Tb.dL.S) in basal (BAS), vehicle (aging) control (CON), prednisone alone (GC) and GC plus 80 mg Sal B/kg/d (GC+B80) treated rats. Arrows point to interlabeling distances after double labeling with tetracycline and calcein. The interlabeling distance in the growth plate was used to determine longitudinal growth rate (LGR). There were age-related decreases in LGR and in endocortical bone formation from 6 month (BAS) and 9 month (CON) and a further reduction with prednisone alone treatment (GC), while 80 mg/kg/d of Sal B (GC+80) prevented the GC-induced reduction. There was an absence of double labeling in the trabecular surface after GC treatment, while the GC+B80 section exhibited similar double labeling to BAS and CON rats. (Villanueva bone stain under fluorescence light). Quantitative measurements of dynamic parameters are shown in table 7.
Figure 8
Figure 8. Effects of different treatments on osteoblast morphology and adipocyte distribution and corresponding PPARγ expression.
Representative micrographs in basal (BAS), vehicle (aging) control (CON), prednisone (GC) and GC plus 80 mg Sal B/kg/d (GC+B80) treated cancellous bone in distal femoral metaphysic. Arrows point to osteoblasts (Ob, Goldner's Trichrome stain). Active osteoblasts are present as multi- plump columnar lining on the trabecular surface in BAS and CON rats. The GC treatment induced the appearance of shriveling and inactive osteoblasts (v.s. BAS & CON) while the Sal B treatment protected GC-induced osteoblast impairment (GC+B80 v.s.GC). Adipocyte content (F.Ar, Hematoxylin stain) and corresponding immunohistochemical staining of Peroxisome Proliferator-Activated Receptor γ (PPARγ) expression (arrows from spots, PPARγ stain) increased between 6 and 9 months (BAS v.s. CON). The GC treatment markedly increased adipocyte number and size (GC v.s. BAS & CON), and the amount of PPARγ positive cells, while the Sal B treatment prevented the GC-induced increases (GC+B80 v.s.GC). Quantitative measurements of osteoblasts, fatty area and PPARγ expression are shown in table 6 and table 8.
Figure 9
Figure 9. Effects of different treatments on marrow microvessel structures.
Representative micrographs of immunohistochemical staining of Von Willbrand Factor (vWF) in microvessel endothelial cells of the distal femoral metaphysis from basal (BAS), aging control (CON), Sal B alone (B40), prednisone treated (GC), GC plus Sal B40 m g/kg/d (GC+B40) and GC plus Sal B80 mg/kg/d (GC+B80). The diameter of microvessels but not density increased between 6 and 9 months (BAS v.s. CON). The GC treatment markedly decreased the density and diameter of microvessels with the appearance microvessels squeezed by the increased adipocytes (GC v.s. BAS & CON). Sal B treatment prevented the GC induced changes. High dose (Sal B80 mg/kg/d) treatment significant increased the diameter of the microvessels (double arrows) (vs. GC & CON). Quantitative measurements of microvessel diameter (DMV) and density (MVD) are shown in table 8.
Figure 10
Figure 10. Effects of different treatments on BMP-2 and BMP-7 expression.
A: Representative micrographs of immunohistochemical staining of BMP-2 in femur bone marrow and trabeculae from control (CON), prednisone treated (GC), GC plus Sal B40 m g/kg/d (GC+B40) and GC plus Sal B80 mg/kg/d (GC+B80). BMP-2 was stained as brown color with sand-like deposition along trabecular surface and marrow mesenchymal stem cells. The GC treatment markedly decreased the BMP-2 expression while Sal B treatment prevented the GC induced changes. B: Electrophoresis image of BMP-2 and BMP-7 mRNA expression in rat whole femur bone was determined by RT-PCR. The rats treated with GC decreased both BMP-2 and BMP-7 mRNA expression. Treatment of Sal 40 and 80 mg/kg/d completely prevented the GC induced changes, Sal 40 mg/kg/d alone did not affect the BMP-2 and BMP-7 mRNA expression. Value are mean ± SD, *P<0.05, ** P<0.01 vs CON; # P<0.05, # # P<0.01 vs GC.
Figure 11
Figure 11. Effects of Sal B on the proliferation and differentiation in new born rat calvarium osteoblast.
Cells were inoculated in 96-well plates and cultured, then transferred to a medium containing various concentrations of vehicle and Sal B. MTT was tested at 24, 48, 72 and 96 h of incubation (A), ALP activity (represent by OD value) was determined later until 7 days of incubation (B), and the content of osteocalcin (µg/L) in culture medium was determined 1n day 21 after incubated with different treatment (C). Data shown are mean ± SD. n = 6. **P<0.01, *P<0.01 versus control (vehicle treatment).
Figure 12
Figure 12. Effects of Sal B on rat marrow stromal cell (rMSC) differentiation into osteoblast.
Cells were collected from the femur marrow of one month old SD rats. Cells inoculated in 25 mm2 culture flask and cultured. The cells used in the study were the 3 passage, then transferred to the medium containing osteoblast induction medium (OB-in), Sal B and OB-in plus various concentrations of Sal B respectively. A: ALP activity (represent by OD value) was determined at 3, 5 and 7 days. B: the content of osteocalcin (µg/L) in culture medium was determined 1n day 21 after incubated with different treatment. Data shown are mean ± SD. n = 6. **P<0.01, *P<0.05 versus control (vehicle treatment).
Figure 13
Figure 13. Effects of Sal B on the gene expression of Dkk-1/β-catenin pathway in rat marrow stromal cell (rMSC) differentiation.
rMSC were cultured with osteoblast induction medium (OB-in), adipocyte induction medium (Ad-in, i.e. high concentration of GC), with or without Sal B (10-7 mol/L) and Sal A (5×10⁻⁷ mol/L, a derivant of Sal B, Figure 1) for 7 days. Expression levels of Runx2 (A) , PPARγ (B), β-catenin (C and D) and DKK-1 (E) were measured by RT-PCR. Sal B increased Runx2 and β-catenin mRNA expression and decreased DKK-1 mRNA expression which was similar to the action of OB-in. Ad-in marked increased PPARγ and DKK-1 mRNA expression. When treated the Ad-in rMSC with Sal B, the PPARγ and DKK-1 mRNA expression decreased obviously. Sal A had similar effects to Sal B.

References

    1. Shah SK, Gecys GT. Prednisone-Induced Osteoporosis: An Overlooked and Undertreated Adverse Effect. J Am Osteopath Assoc. 2006;106:653–657. - PubMed
    1. Canalis E. Mechanisms of glucocorticoid action in bone. Curr Osteoporos Rep. 2005;3:98–102. - PubMed
    1. Ito S, Suzuki N, Kato S. Glucocorticoids induce the differentiation of a mesenchymal progenitor cell line, ROB-C26 into adipocytes and osteoblasts, but fail to induce terminal osteoblast differentiation. Bone. 2007;40:84–92. - PubMed
    1. Weinstein RS. Glucocorticoids, osteocytes, and skeletal fragility: The role of bone vascularity. Bone. 2010;46:564–570. - PMC - PubMed
    1. Kerachian MA, Séguin C, Harvey EJ. Glucocorticoids in osteonecrosis of the femoral head: a new understanding of the mechanisms of action. J Steroid Biochem Mol Biol. 2009;114:121–128. - PMC - PubMed

Publication types

MeSH terms