. 2012:2:356.
doi: 10.1038/srep00356. Epub 2012 Apr 10.

Single cell genome analysis supports a link between phagotrophy and primary plastid endosymbiosis

Single cell genome analysis supports a link between phagotrophy and primary plastid endosymbiosis

Debashish Bhattacharya et al. Sci Rep. 2012.

Abstract

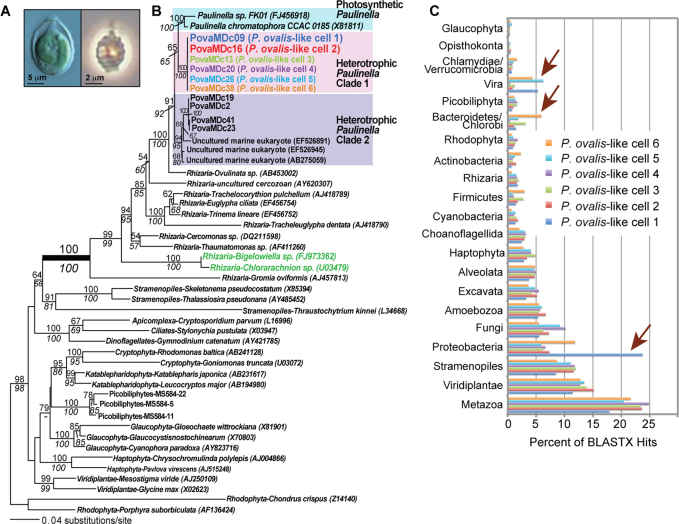
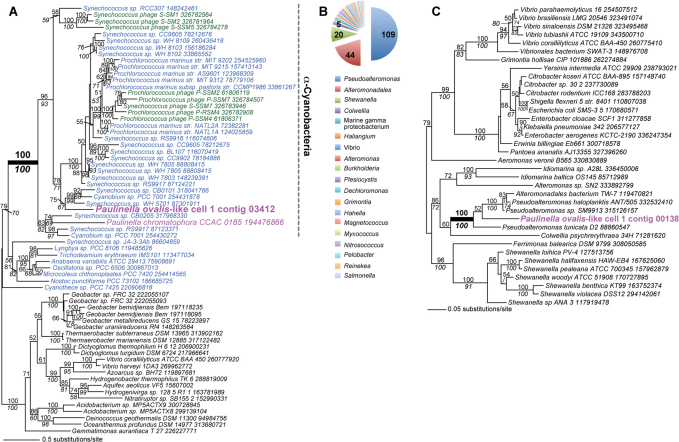
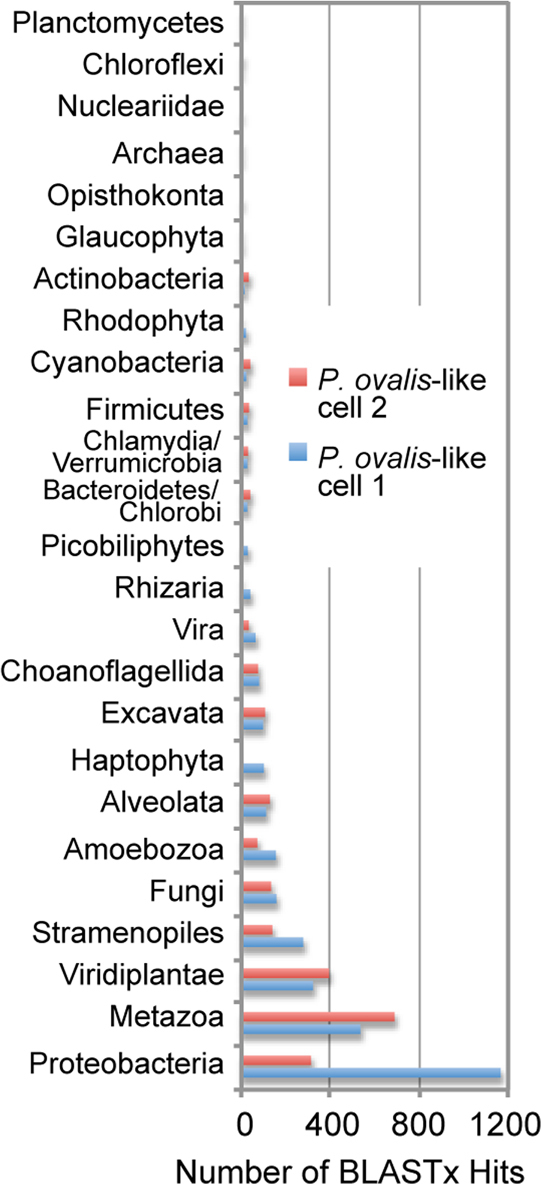
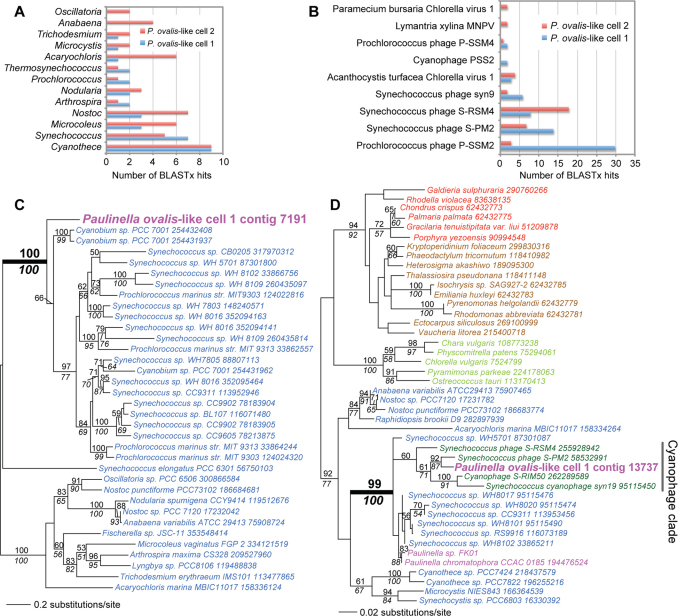
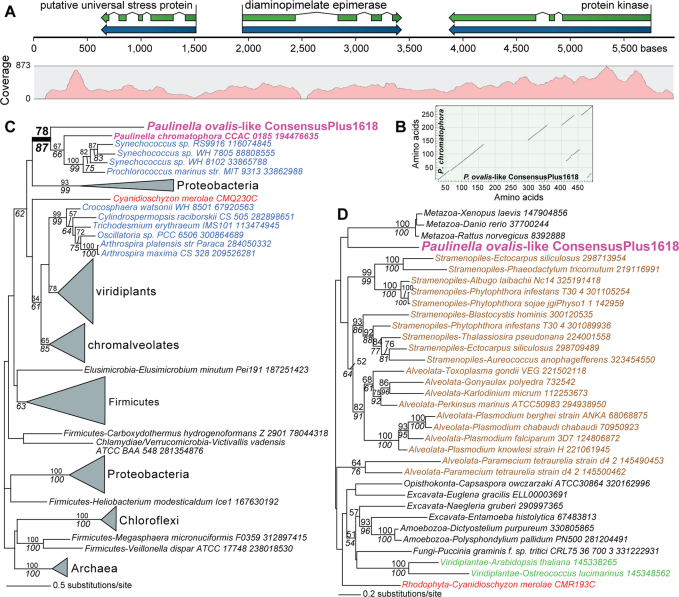
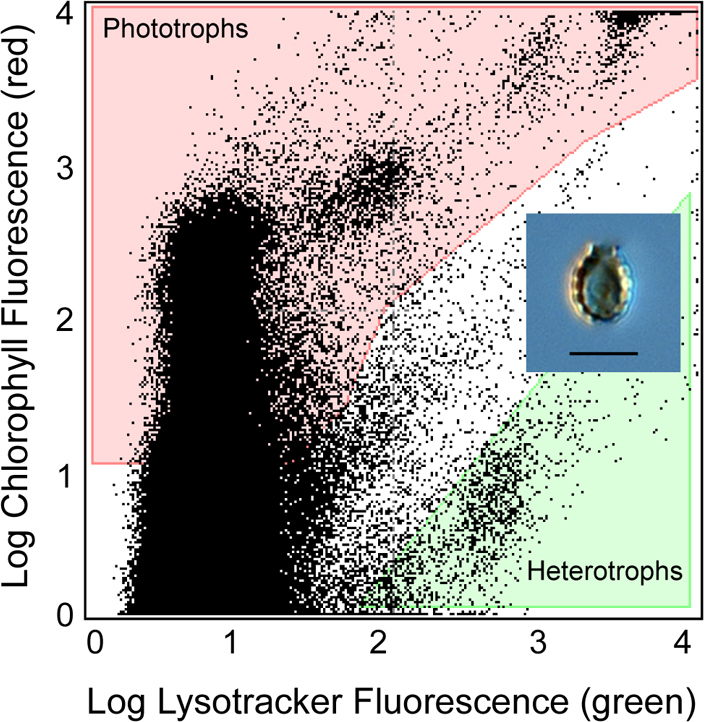
Two cases of primary plastid endosymbiosis are known. The first occurred ca. 1.6 billion years ago and putatively gave rise to the canonical plastid in algae and plants. The second is restricted to a genus of rhizarian amoebae that includes Paulinella chromatophora. Photosynthetic Paulinella species gained their plastid from an α-cyanobacterial source and are sister to plastid-lacking phagotrophs such as Paulinella ovalis that ingest cyanobacteria. To study the role of feeding behavior in plastid origin, we analyzed single-cell genome assemblies from six P. ovalis-like cells isolated from Chesapeake Bay, USA. Dozens of contigs in these cell assemblies were derived from prey DNA of α-cyanobacterial origin and associated cyanophages. We found two examples of horizontal gene transfer (HGT) in P. ovalis-like nuclear DNA from cyanobacterial sources. This work suggests the first evidence of a link between feeding behavior in wild-caught cells, HGT, and plastid primary endosymbiosis in the monophyletic Paulinella lineage.


Figures

Figure 1
Figure 1. Evolutionary analyses of Paulinella ovalis-like SAGs.
(a) Light microscopy image of the photosynthetic Paulinella chromatophora (left) and its phagotrophic sister P. ovalis (right). (b) RAxML tree (GTR + Γ + I model) inferred from 18S rDNA showing the phylogenetic position of P. ovalis-like cells within Rhizaria. Single-cell sorting identified several P. ovalis-like cells that comprise two distinct heterotrophic Paulinella clades (Clade 1 and Clade 2) of which Clade 1 is most closely related to the photosynthetic P. chromatophora and Paulinella sp. FK01, and is the subject of our study. RAxML and PhyML bootstrap values are shown above and below the branches, respectively (only those ≥ 60% are shown). The unit of branch length is the number of substitutions per site. The GenBank accession numbers (where available) are shown after each taxon name. (c) Taxonomic distribution of unique BLASTx hits (e-value ≤10−10) using the contigs from the six P. ovalis-like single cell SAGs for which we have 454 data. The percentage distribution of each phylum across all six SAGs is shown. The arrows indicate markedly different phyletic origins of DNA among the SAGs.
Figure 2
Figure 2. Bacterial DNA is present in the P. ovalis-like cell 1 SAG assembly.
(a) Maximum likelihood (RAxML, WAG + Γ + F model) phylogeny of PstS phosphate ABC transporter proteins. Cyanobacteria are in blue text, other Bacteria are in black text, the chromatophore (plastid) and the sequence encoded on P. ovalis-like cell 1 contig 03412 are in magenta text, and cyanophage sequences are in dark green. The well-supported clade that includes α-Cyanobacteria is identified with the dashed gray line. (b) Taxonomic distribution of BLASTx hits to Proteobacteria in the 454 assembly of P. ovalis-like cell 1. (c) Maximum likelihood (RAxML, WAG + Γ + F model) phylogeny of the transcription elongation factor NusA. P. ovalis-like cell 1 contig 00138 is shown in magenta text. RAxML and PhyML bootstrap values (100 replicates) in 2A and 2C are shown above and below the branches, respectively (only those ≥ 50% are shown). The unit of branch length is the number of substitutions per site. The NCBI “gi” numbers are shown after each taxon name.
Figure 3
Figure 3. Taxonomic distribution of BLASTx hit numbers using the contigs from P. ovalis-like cells 1 and 2 for which we have 454 + Illumina data.
Figure 4
Figure 4. Cyanobacterial and cyanophage DNA identified in the combined (454 + Illumina) assemblies of P. ovalis-like cells 1 and 2.
(a) Taxonomic distribution of BLASTx hits to Cyanobacteria, using the cell 1 and 2 contigs. (b) Taxonomic distribution of BLASTx hits to virus sequences using the cell 1 and 2 contigs. (c) Maximum likelihood (RAxML, WAG + Γ + F model) phylogeny of bacterial porin (OprB) proteins. (d) Maximum likelihood (RAxML, WAG + Γ + F model) phylogeny of photosystem II D2 (PsbD) proteins. In 4C and 4D, Cyanobacteria are in blue text, other Bacteria are in black text, the chromatophore (plastid) and the P. ovalis-like cell data are in magenta text, cyanophage sequences are in dark green, Viridiplantae is in light green text, red algae in red text, and chromalveolates in brown text. The well-supported clade that includes cyanophages is identified with the gray bar. RAxML and PhyML bootstrap values (100 replicates) are shown above and below the branches, respectively (only those ≥ 50% are shown). The unit of branch length is the number of substitutions per site. The NCBI “gi” numbers are shown after each taxon name.
Figure 5
Figure 5. An example of α-cyanobacterial HGT found in the P. ovalis-like SAG data.
(a) Intron distribution and coverage of P. ovalis-like genome contig ConsensusPlus1618 that encodes three proteins. (b) Dot plot analysis of DAP epimerase from P. ovalis-like cells and the homolog that is encoded in the plastid genome of P. chromatophora CCAC 0185 showing the intron positions in the P. ovalis-like sequence. (c) Maximum likelihood (RAxML, WAG + Γ + F model) phylogeny of diaminopimelate epimerase (DapF) proteins. (d) Maximum likelihood (RAxML, WAG + Γ + F model) phylogeny of putative protein kinases. In 5B and 5C, Cyanobacteria are in blue text, other Bacteria are in black text, the chromatophore (plastid) and the P. ovalis-like cell data are in magenta text, Viridiplantae is in green text, red algae in red text, and chromalveolates in brown text. RAxML and PhyML bootstrap values (100 replicates) are shown above and below the branches, respectively (only those ≥ 50% are shown). The unit of branch length is the number of substitutions per site. The NCBI “gi” numbers (when available) are shown after each taxon name.
Figure 6
Figure 6. Flow cytometric dot plot of the Lysotracker stained field sample.
The heterotrophic protist sort region (shaded green) was identified as containing high relative green fluorescence (Lysotracker-stained food vacuoles) and low relative red fluorescence (indicative of chlorophyll). Phototrophs (shaded red) have both high chlorophyll fluorescence and Lysotracker fluorescence. A light microscopic image of a P. ovalis-like cell is shown in the inset (the scale bar indicates 5 μm).

References

    1. Cavalier-Smith T. & Lee J. J. Protozoa as hosts for endosymbioses and the conversion of symbionts into organelles. J. Protozool. 32, 376–379 (1985).
    1. Rodríguez-Ezpeleta N. et al. Monophyly of primary photosynthetic eukaryotes: green plants, red algae, and glaucophytes. Curr. Biol. 15, 1325–1330 (2005). - PubMed
    1. Adl S. M. et al. The new higher level classification of eukaryotes with emphasis on the taxonomy of protists. J. Eukaryot. Microbiol. 52, 399–451(2005). - PubMed
    1. Chan C. X. et al. Red-and-green algal monophyly and extensive gene sharing found in a rich repertoire of red algal genes. Curr. Biol. 21, 328–333 (2011). - PubMed
    1. Archibald J. M. et al. Lateral gene transfer and the evolution of plastid-targeted proteins in the secondary plastid-containing alga Bigelowiella natans. Proc. Natl. Acad. Sci. USA 100, 7678–7683 (2003). - PMC - PubMed