. 2012 Jul;82(2):226-34.
doi: 10.1038/ki.2012.108. Epub 2012 Apr 11.

Laser microdissection and mass spectrometry-based proteomics aids the diagnosis and typing of renal amyloidosis

Affiliations
Free PMC article

Laser microdissection and mass spectrometry-based proteomics aids the diagnosis and typing of renal amyloidosis

Sanjeev Sethi et al. Kidney Int. 2012 Jul.
Free PMC article

Abstract

Accurate diagnosis and typing of renal amyloidosis is critical for prognosis, genetic counseling, and treatment. Laser microdissection and mass spectrometry are emerging techniques for the analysis and diagnosis of many renal diseases. Here we present the results of laser microdissection and mass spectrometry performed on 127 cases of renal amyloidosis during 2008-2010. We found the following proteins in the amyloid deposits: immunoglobulin light and heavy chains, secondary reactive serum amyloid A protein, leukocyte cell-derived chemotaxin-2, fibrinogen-α chain, transthyretin, apolipoprotein A-I and A-IV, gelsolin, and β-2 microglobulin. Thus, laser microdissection of affected areas within the kidney followed by mass spectrometry provides a direct test of the composition of the deposit and forms a useful ancillary technique for the accurate diagnosis and typing of renal amyloidosis in a single procedure.


Figures

Figure 1
Figure 1
Laser microdissection. Congo red–positive (a) glomeruli, (b) vessels, and (c) interstitium marked for microdissection. (d) Empty space following microdissection of glomeruli from a.
Figure 2
Figure 2
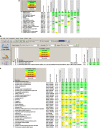
Mass spectrometry by spectra. (a) Representative mass spectrometry data by spectral analyses from a case of AL lambda light-chain amyloidosis (AL-lambda), AL kappa light-chain amyloidosis (AL-kappa), heavy-chain amyloidosis (AH), AA amyloidosis (AA), fibrinogen-α amyloidosis (AFib), LECT-2 amyloidosis (ALect2), transthyretin (TTR) amyloidosis (ATTR), gelsolin amyloidosis (AGel), and apolipoprotein A-IV amyloidosis (ApoAIV). The probability number (>95% is highlighted in green, 80–94% in yellow) indicates essentially the percent homology between peptides detected in the specimens and the published amino-acid sequences of their corresponding proteins. VOR, NEWM, and Rei are names that have been given to specific sequences of variable regions. (b) Representative mass spectrometry data from a case of fibrinogen-α amyloidosis showing both the fibrinogen-α chain and the mutated fibrinogen-α peptide. (c) Representative mass spectrometry data from day 0 protocol allograft biopsies in seven cases. Red star indicates shared peptides between different proteins. Ig, immunoglobulin.
Figure 3
Figure 3
Percentage sequence (peptide) coverage. Representative sequence (peptide) coverage of the protein detected in the microdissected sample showing: (a) 15 total spectra, 6 unique spectra, and 5 unique peptides for 64% coverage of Ig lambda light-chain constant region with 100% probability; (b) 8 total spectra, 2 unique spectra, and 2 unique peptides for 15% coverage of Ig lambda light chain variable I region with 100% probability; (c) 18 total spectra, 6 unique spectra, and 4 unique peptides for 64% coverage of Ig kappa light-chain constant region with 100% probability; (d) 4 total spectra, 2 unique spectra, and 2 unique peptides for 19% coverage of IgG1 heavy constant chain with 100% probability; (e) 5 total spectra, 3 unique spectra, and 3 unique peptides for 8% coverage of IgG3 heavy constant chain with 100% probability; (f) 37 total spectra, 7 unique spectra, and 6 unique peptides for 35% coverage of serum amyloid A (SAA) protein with 100% probability; (g) 42 total spectra, 11 unique spectra, and 10 unique peptides for 10% coverage of fibrinogen-α protein with 100% probability; (h) 11 total spectra, 4 unique spectra, and 4 unique peptides for 23% coverage of LECT2 with 100% probability; (i) 33 total spectra, 16 unique spectra, and 16 unique peptides for 17% coverage of gelsolin protein with 100% probability; (j) 11 total spectra, 7 unique spectra, and 5 unique peptides for 32% coverage of β-2 microglobulin with 100% probability; and (k) 37 total spectra, 16 unique spectra, and 14 unique peptides for 63% coverage of transthyretin (TTR) with 100% probability. The yellow highlighted areas show the actual peptides detected by the mass spectrometry, and the green highlighted areas show oxidized or methylated amino acids.
Figure 3
Figure 3
Percentage sequence (peptide) coverage. Representative sequence (peptide) coverage of the protein detected in the microdissected sample showing: (a) 15 total spectra, 6 unique spectra, and 5 unique peptides for 64% coverage of Ig lambda light-chain constant region with 100% probability; (b) 8 total spectra, 2 unique spectra, and 2 unique peptides for 15% coverage of Ig lambda light chain variable I region with 100% probability; (c) 18 total spectra, 6 unique spectra, and 4 unique peptides for 64% coverage of Ig kappa light-chain constant region with 100% probability; (d) 4 total spectra, 2 unique spectra, and 2 unique peptides for 19% coverage of IgG1 heavy constant chain with 100% probability; (e) 5 total spectra, 3 unique spectra, and 3 unique peptides for 8% coverage of IgG3 heavy constant chain with 100% probability; (f) 37 total spectra, 7 unique spectra, and 6 unique peptides for 35% coverage of serum amyloid A (SAA) protein with 100% probability; (g) 42 total spectra, 11 unique spectra, and 10 unique peptides for 10% coverage of fibrinogen-α protein with 100% probability; (h) 11 total spectra, 4 unique spectra, and 4 unique peptides for 23% coverage of LECT2 with 100% probability; (i) 33 total spectra, 16 unique spectra, and 16 unique peptides for 17% coverage of gelsolin protein with 100% probability; (j) 11 total spectra, 7 unique spectra, and 5 unique peptides for 32% coverage of β-2 microglobulin with 100% probability; and (k) 37 total spectra, 16 unique spectra, and 14 unique peptides for 63% coverage of transthyretin (TTR) with 100% probability. The yellow highlighted areas show the actual peptides detected by the mass spectrometry, and the green highlighted areas show oxidized or methylated amino acids.

References

    1. Dember LM. Amyloidosis-associated kidney disease. J Am Soc Nephrol. 2006;17:3458–3471. - PubMed
    1. Merlini G, Bellotti V. Molecular mechanisms of amyloidosis. N Engl J Med. 2003;349:583–596. - PubMed
    1. Gillmore JD, Lachmann HJ, Rowczenio D, et al. Diagnosis, pathogenesis, treatment, and prognosis of hereditary fibrinogen A{alpha}-chain amyloidosis. J Am Soc Nephrol. 2009;20:444–451. - PMC - PubMed
    1. Lachmann HJ, Booth DR, Booth SE, et al. Misdiagnosis of hereditary amyloidosis as AL (primary) amyloidosis. N Engl J Med. 2002;346:1786–1791. - PubMed
    1. Sethi S, Theis JD, Leung N, et al. Mass spectrometry based proteomic diagnosis of renal immunoglobulin heavy chain amyloidosis. Clin J Am Soc Nephrol. 2010;5:2180–2187. - PMC - PubMed

MeSH terms