. 2012 Aug;82(3):278-91.
doi: 10.1038/ki.2012.102. Epub 2012 Apr 11.

In vivo regulation of the heme oxygenase-1 gene in humanized transgenic mice

Affiliations

In vivo regulation of the heme oxygenase-1 gene in humanized transgenic mice

Junghyun Kim et al. Kidney Int. 2012 Aug.

Abstract

Heme oxygenase-1 (HO-1) catalyzes the rate-limiting step in heme degradation, producing equimolar amounts of carbon monoxide, iron, and biliverdin. Induction of HO-1 is a beneficial response to tissue injury in diverse animal models of diseases including acute kidney injury. In vitro analysis has shown that the human HO-1 gene is transcriptionally regulated by changes in chromatin conformation, but whether such control occurs in vivo is not known. To enable such an analysis, we generated transgenic mice, harboring an 87-kb bacterial artificial chromosome expressing human HO-1 mRNA and protein and bred these mice with HO-1 knockout mice to generate humanized BAC transgenic mice. This successfully rescued the phenotype of the knockout mice including reduced birth rates, tissue iron overload, splenomegaly, anemia, leukocytosis, dendritic cell abnormalities, and survival after acute kidney injury induced by rhabdomyolysis or cisplatin nephrotoxicity. Transcription factors such as USF1/2, JunB, Sp1, and CTCF were found to associate with regulatory regions of the human HO-1 gene in the kidney following rhabdomyolysis. Chromosome conformation capture and ChIP-loop assays confirmed this in the formation of chromatin looping in vivo. Thus, these bacterial artificial chromosome humanized HO-1 mice are a valuable model to study the human HO-1 gene, providing insight to the in vivo architecture of the gene in acute kidney injury and other diseases.


Conflict of interest statement

The authors have no conflicts of interest to disclose.

Figures
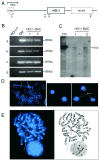
Figure 1
Figure 1. Generation of heme oxygenase-1 (HO-1) bacterial artificial chromosome (BAC) transgenic mice
(A) Schematic of ~87 kb human BAC DNA (GenBank accession number: Z82244), a portion of human chromosome 22, containing the HO-1 gene along with the 3′ end of TOM1, and MCM5 genes used for the generation of HO-1 BAC mice is shown. a, b, c and d represent the amplicons which were used to genotype the HO-1 BAC transgenic mice. Sequences of primers are listed in Table 1. (B) Four primer pairs were used to amplify regions a–d by PCR for genotyping the HO-1 BAC transgenic mice using tail DNA. DNA from wild-type C57BL6/J was used as a negative control (HO-1+/+). Positive control was purified HO-1 BAC DNA used for the generation of HO-1 BAC transgenic mice. (C) Founder mice were identified by Southern blot analysis of tail DNA using a 320-bp PCR amplicon (region b) used as a probe after EcoRI digestion. Purified BAC DNA was used as a positive control (+Ctrl) and two founders (1 and 2) are shown. (D) FISH analyses were performed on interphase peripheral blood cells from HO-1 BAC mice using the HO-1 BAC containing DNA as a probe (right panel). Human metaphase peripheral blood cells were used as positive control and arrows indicate the hybridization location of the HO-1 probe labeled in SpectrumOrange on chromosome 22 band q12.3 (left panel). Negative control using the HO-1 probe on peripheral blood cells from non-transgenic mouse (middle panel). (E) FISH analysis on HO-1 BAC transgenic bone marrow metaphase spread using the HO-1 BAC as a FISH probe labeled in SpectrumOrange (left panel). Note the single site of integration of the HO-1 BAC into chromosome 5 band qF (right panel).
Figure 2
Figure 2. HO-1 protein and mRNA are overexpressed in organs of HO-1 BAC transgenic mice
(A) Average body weights of HO-1 BAC mice (n=5, solid square) and HO-1+/+ mice (n=4, open diamond) that were monitored for 19 months. (B) Total RNA was isolated from indicated organs and HO-1 mRNA expression level was quantified using real-time PCR. GAPDH was used to normalize HO-1 mRNA levels. Results are shown as fold-increase versus HO-1+/+ from 3 independent experiments performed in triplicate each time (Mean ± SEM). * p<0.01 (C) HO enzyme activity in indicated organs of HO-1+/+ and HO-1 BAC transgenic mice was compared. Results are shown as fold-increase versus HO-1+/+ from 3 independent experiments performed (Mean ± SEM) * p<0.05. (D) Indicated tissues were harvested and HO-1 protein expression was determined by Western analysis. Anti-GAPDH antibody was used as a loading control. (E) HO-1 expression was determined by immunohistochemistry using HO-1 antibody (SPA-896, Stressgen) in brain, heart, lung, liver, spleen, and kidney tissues from HO-1+/+ and HO-1 BAC transgenic mice. (F) Localization of HO-1 protein was determined by staining with lotus lectin (proximal tubule marker) and HO-1 on serial sections of kidneys from HO-1 BAC transgenic mice. Arrows indicate co-localization of HO-1 and lotus lectin in proximal tubules.
Figure 3
Figure 3. Generation and characterization of “humanized” HO-1 BAC (hHO-1 BAC) mice
(A) Five transgenic mice were obtained from a pair of HO-1+/− BAC positive mice. Primers for HO-1 BAC (a and b, Table 1, Figure 1A) were used to screen whether they were positive for HO-1 BAC. Mice were also genotyped using a combination of primers for the detection of mouse HO-1 gene (lower 160-bp band) and/or neomycin cassette (upper 280-bp band) inserted in order to generate HO-1−/− mice (Table 1). (B) Genomic DNA was used to evaluate the presence of mouse and human HO-1. While the genotyping of HO-1+/+ mice reveals a single band at 160 bp for mouse HO-1, the absence of mouse HO-1 in hHO-1 BAC mice gives a single band at 280 bp denoting the presence of the neomycin cassette derived from the HO-1−/− mice. A heterozygote would reveal two bands at 160 and 280 bp. The presence of human HO-1 in hHO-1 BAC mice is confirmed by using a human specific primer that yields a 320 bp band. (C) Microsomal fractions of kidney and spleen from HO-1+/+, HO-1−/−, and hHO-1 BAC mice were isolated and analyzed by immunoblot for HO-1 expression. The blot was stripped and reprobed with anti-actin antibody for a loading control.
Figure 4
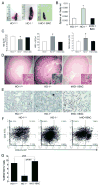
Figure 4. Human HO-1 in hHO-1 BAC transgenic mice rescues the pathological phenotype of HO-1−/− mice
Spleens from 25–35 week-old HO-1+/+ (n=8), HO-1−/− (n=7), and hHO-1 BAC (n=7) transgenic mice were collected and their lengths (A) and weights (B) were compared. Weights of spleen were normalized to body weight of each animal, and average normalized values were plotted for each group (Mean±SEM) * p<0.05 vs. HO-1+/+ and hHO-1 BAC mice. (C) Whole blood from 30–40 week-old HO-1+/+, HO-1−/−, and hHO-1 BAC mice were collected and hemoglobin (Hgb), leukocyte (WBC) and reticulocyte counts were measured (n=4–5/group). * p<0.05 vs. HO-1+/+ and hHO-1 BAC mice. (D) Kidneys from 25–35 week-old HO-1+/+, HO-1−/−, and hHO-1 BAC mice were collected and Prussian blue staining was performed to detect tissue iron in paraffin-embedded sections. (E) Peripheral blood smears were prepared from HO-1+/+, HO-1−/−, and hHO-1 BAC mice and stained using Wright-Giemsa staining to determine RBC morphology. (F and G) Subsets of splenic DC from HO-1+/+, HO-1−/−, and hHO-1 BAC transgenic mice were compared as described in Methods. CD8 and CD4 expression is shown on CD11c and MHC II-gated cells from each group of mice (F). Numbers within graph quadrants depict the percentage of CD11c+MHC II+ positive cells. The histogram shown depicts the average from three animals in the percentage of CD8+ DC among the population of CD11c+MHC II+ DC.
Figure 5
Figure 5. HO-1 expression is induced at higher levels after rhabdomyolysis in hHO-1 BAC mice
Rhabdomyolysis was induced by injecting 50% glycerol (7.5 ml/kg body weight) in HO-1+/+ and hHO-1 BAC mice (A and B, respectively) (n=9/group). Kidneys from HO-1+/+ and hHO-1 BAC mice were collected and total RNA was isolated. At 8 hours post glycerol administration HO-1 was induced ~30 fold in HO-1+/+ (panel A) kidneys, while the hHO-1 BAC kidneys revealed ~14 fold HO-1 induction (panel B) *p<0.01. (C) Microsomal fractions from kidneys of HO-1+/+ and hHO-1 BAC mice after injection of saline (S) as a control and 50% glycerol (G) for 16 h were analyzed for HO-1 protein expression using Western analysis. Note that normalization of the band intensity to corresponding actin levels shows no significant difference between glycerol treated HO-1+/+ and hHO-1 BAC saline treated mice. (D) Kidneys of HO-1+/+ and hHO-1 BAC mice after injection of saline (S) and glycerol (G) were collected and HO enzyme activity was measured at 16 h after glycerol administration as described in the Methods. (n=3/group) *p<0.05 vs. HO-1+/+ (E) Survival rate was monitored after induction of rhabdomyolysis in HO-1+/+, HO-1−/−, and hHO-1 BAC mice (n=10/group). Experiments were ceased 10 days after injection. (F) Serum creatinine was measured in HO-1+/+, HO-1−/−, and hHO-1 BAC mice after indicated days after induction of rhabdomyolysis.
Figure 6
Figure 6. Glycerol-induced rhabdomyolysis induces chromatin-looping-mediated promoter-enhancer interaction and increases binding of JunB, Sp1, USF1/2, and CTCF to regulatory regions of the human HO-1 gene in vivo
(A–C) hHO-1 BAC transgenic mice were injected with 7.5 ml/kg body wt 50% glycerol (G) or saline (S) and kidneys were harvested after 3 h. An in vivo ChIP assay was performed to determine changes in association of indicated transcription factors within the −4.5kb human HO-1 promoter region (A), 220-bp intronic enhancer region (B), and the +2.2kb internal E-box region as a negative control (C) as described in Methods. Results represent three independent experiments and fold enrichment vs. saline-injected mice are shown (Mean ± SEM). (D) Kidneys from hHO-1 BAC transgenic mice injected with 50% glycerol or saline were harvested and in vivo ChIP was performed to determine the association of CTCF with −4.5kb promoter, 220-bp enhancer, and proximal E-box regions. The +2.2kb E-box region was used as negative control. Results represent two independent experiments and relative fold enrichments vs. saline-injected mice are shown (Mean ± SEM). *p<0.05 vs. saline-treated hHO-1 BAC mice. (E) Map of the human HO-1 promoter, where B denotes BglII restriction sites flanking the −4.5kb promoter regions, proximal E-box elements, and 220-bp enhancer (E). Arrows denote primers used for 3C assay. Gray rectangles indicate exons in the human HO-1 gene. (F) hHO-1 BAC mice were injected with glycerol (G) and saline (S) for 3 h and kidneys were harvested. 3C assay was performed to determine the interaction between −4.5kb promoter and 220-bp enhancer (F2/R2) using BglII restriction enzyme. Interactions between promoter and enhancer regions were determined and quantified as relative crosslinking efficiency. Results shown are from 3 independent experiments (Mean ± SEM). *p<0.05 vs. saline-injected hHO-1 BAC mice.

Comment in

References

    1. Tenhunen R, Marver HS, Schmid R. Microsomal heme oxygenase. Characterization of the enzyme. J Biol Chem. 1969;244:6388–6394. - PubMed
    1. Maines MD. The heme oxygenase system: a regulator of second messenger gases. Annu Rev Pharmacol Toxicol. 1997;37:517–554. - PubMed
    1. Yoshida T, Kikuchi G. Purification and properties of heme oxygenase from pig spleen microsomes. J Biol Chem. 1978;253:4224–4229. - PubMed
    1. Hayashi S, Omata Y, Sakamoto H, et al. Characterization of rat heme oxygenase-3 gene. Implication of processed pseudogenes derived from heme oxygenase-2 gene. Gene. 2004;336:241–250. - PubMed
    1. Poss KD, Tonegawa S. Heme oxygenase 1 is required for mammalian iron reutilization. Proc Natl Acad Sci U S A. 1997;94:10919–10924. - PMC - PubMed

Publication types

MeSH terms

LinkOut - more resources