. 2012 Sep 15;590(18):4403-22.
doi: 10.1113/jphysiol.2012.227926. Epub 2012 Apr 10.

Modelling cardiac calcium sparks in a three-dimensional reconstruction of a calcium release unit

Affiliations

Modelling cardiac calcium sparks in a three-dimensional reconstruction of a calcium release unit

Johan Hake et al. J Physiol. .

Abstract

Triggered release of Ca2+ from an individual sarcoplasmic reticulum (SR) Ca(2+) release unit (CRU) is the fundamental event of cardiac excitation–contraction coupling, and spontaneous release events (sparks) are the major contributor to diastolic Ca(2+) leak in cardiomyocytes. Previous model studies have predicted that the duration and magnitude of the spark is determined by the local CRU geometry, as well as the localization and density of Ca(2+) handling proteins. We have created a detailed computational model of a CRU, and developed novel tools to generate the computational geometry from electron tomographic images. Ca(2+) diffusion was modelled within the SR and the cytosol to examine the effects of localization and density of the Na(+)/Ca(2+) exchanger, sarco/endoplasmic reticulum Ca(2+)-ATPase 2 (SERCA), and calsequestrin on spark dynamics. We reconcile previous model predictions of approximately 90% local Ca(2+) depletion in junctional SR, with experimental reports of about 40%. This analysis supports the hypothesis that dye kinetics and optical averaging effects can have a significant impact on measures of spark dynamics. Our model also predicts that distributing calsequestrin within non-junctional Z-disc SR compartments, in addition to the junctional compartment, prolongs spark release time as reported by Fluo5. By pumping Ca(2+) back into the SR during a release, SERCA is able to prolong a Ca(2+) spark, and this may contribute to SERCA-dependent changes in Ca(2+) wave speed. Finally, we show that including the Na(+)/Ca(2+) exchanger inside the dyadic cleft does not alter local [Ca(2+)] during a spark.


Figures
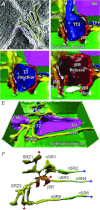
Figure 1
Figure 1. Geometry generation
A, the Ca2+ release unit (CRU) was manually segmented from a stack of electron tomography images. Here parts of a single tomogram are shown. The segmented features are: mitochondria (pink), sarcoplasmic reticulum (SR) (yellow) and t-tubules (blue). B, the CRU is formed by junctional SR (jSR) wrapping around the t-tubule. The t-tubule boundary in the CRU is split into two distinct boundaries, junctional and non-junctional. In C, the junctional part is shown. The boundary of jSR is split into three distinct boundaries. jSR Back (orange), jSR Release (dark red) and jSR Rim (red). D, the junctional part with the t-tubule completely removed. Here one clearly sees the Release boundary. E, the segmented geometry is eventually turned into a high quality annotated surface mesh. Here for visualization purposes it is shown with the upper and front side removed. The dimension of the mesh is: 1430 × 940 × 406 nm. F, the SR is divided into nine distinct compartments, 1 jSR, 2 Z-line SR compartments, and 6 network SR compartments. Each SR compartment interfaces with the cytosol across the boundaries shown here. The compartments are also connected with each other (black lines) and with either the bulk SR compartments (blue lines), or the intermediate SR compartments (red lines), at the limits of the mesh.
Figure 2
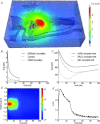
Figure 2. Ca2+ characteristics
A, a volumetric representation of the [Ca2+] in the cytosol domain after 5 ms. B, the average [Ca2+] at three different positions: backside boundary of jSR (continuous line), the whole cytosolic domain (dashed line), and at the boundary of the 6th nSR compartment (dash-dotted line). C, the free Ca2+ content in three SR domains during a spark: the 6th nSR compartment (continuous line), the 1st Z-line SR compartment (dashed line), and the jSR compartment (dash-dotted line). D, a generated line-scan image from the Fluo4 signal with added noise. The FWHM is 1.0 μm and the FDHM is 28.5 ms. E, a Fluo4 trace from the red marker at the right of the line-scan image.
Figure 3
Figure 3. Ca2+ depletion levels in SR during release
For all panels in this figure the grey lines represent data where CSQN is concentrated in jSR, and the black lines data where CSQN is distributed across all Z-line SR compartments. A, the local Fluo5 F/F0 signal (continuous lines). Assuming a naive release termination at 60% of the original Fluo5 signal, the thin long dashed lines report the release termination time where they cross the x-axis; 23.0 ms for CSQN in jSR and 28.25 ms for CSQN distributed across Z-line nSR. Total available Ca2+ in all SR compartments, including Ca2+ bound to CSQN (dashed lines). The free Ca2+ in the jSR compartment (dotted lines). B, the total release current. C, the same traces as in A), but now with a release termination fitted so the nadir of the local Fluo5 level reaches 60%. The termination times and the Fluo5 nadir times are: 15.1 ms and 36.7 ms for CSQN in jSR and 24.5 ms and 31.8 ms for CSQN distributed across Z-line nSR. D, the total release currents when release termination is included. The integrated number of released Ca2+ are: 39,200 for CSQN in jSR and 35,500 for CSQN distributed across Z-line nSR.
Figure 4
Figure 4. Ca2+ levels at release termination
Dashed lines and open symbols represent data where CSQN is concentrated in jSR, and continuous lines and filled symbols represent data where CSQN is distributed across all Z-line SR compartments. A, the release termination time as a function of Fluo5 dynamics (koff). B, free Ca2+ in jSR (stars) and total available Ca2+ (including Ca2+ bound to CSQN) in all SR compartments (diamonds), at the time of release termination, as a function of Fluo5 dynamics (koff). C, the release termination time as a function of the amount of total CSQN within the local SR. D, free Ca2+ in jSR (stars) and total available Ca2+ (including Ca2+ bound to CSQN) in all SR compartments (diamonds), at the time of release termination, as a function of total CSQN within the local SR.
Figure 5
Figure 5. Local SERCA pump effect
A, the SR Ca2+ refill times were fitted so the time constant for restitution of the local Flou5 signal was 160 ms with SERCA and 212 ms without SERCA (Zima et al. 2008). B, release termination time as a function of SERCA inclusion and SERCA position. The open symbols represent release times where CSQN is concentrated in jSR, and filled symbols represent data where CSQN is distributed across all Z-line SR compartments. C, net Ca2+ released from SR (released Ca2+ minus Ca2+ re-uptaken by SERCA) as a function of SERCA inclusion and SERCA position. D, SERCA induced Ca2+ change in jSR for different fixed cytosolic Ca2+ values.
Figure 6
Figure 6. NCX in the dyad
A, average Ca2+ levels in the cytosolic domain when NCX is included in the dyad (continuous line) and when the NCX is not included (dashed line). B, average Ca2+ levels at the t-tubule boundary within the dyad when NCX is included in the dyad (continuous line) and when the NCX is not included (dashed line). C, current from a single exchanger from within the dyad (continuous line) and from the adjacent t-tubule boundary (dashed line). The theoretical maximal exchange current is 0.8 fA (dash-dotted line).

Similar articles

Cited by

References

    1. Altamirano J, Bers DM. Effect of intracellular Ca2+ and action potential duration on L-type Ca2+ channel inactivation and recovery from inactivation in rabbit cardiac myocytes. Am J Physiol Heart Circ Physiol. 2007;293:H563–H573. - PubMed
    1. Antoons G, Mubagwa K, Nevelsteen I, Sipido KR. Mechanisms underlying the frequency dependence of contraction and [Ca2+]i transients in mouse ventricular myocytes. J Physiol. 2002;543:889–898. - PMC - PubMed
    1. Asghari P, Schulson M, Scriven DRL, Martens G, Moore EDW. Axial tubules of rat ventricular myocytes form multiple junctions with the sarcoplasmic reticulum. Biophys J. 2009;96:4651–4660. - PMC - PubMed
    1. Asghari P, Scriven DRL, Hoskins J, Fameli N, van Breemen C, Moore EDW. The structure and functioning of the couplon in the mammalian cardiomyocyte. Protoplasma. 2011;249(Suppl 1):S31–38. - PubMed
    1. Baddeley D, Jayasinghe ID, Lam L, Rossberger S, Cannell MB, Soeller C. Optical single-channel resolution imaging of the ryanodine receptor distribution in rat cardiac myocytes. Proc Natl Acad Sci U S A. 2009;106:22275–22280. - PMC - PubMed

Publication types

MeSH terms

Substances