Review
. 2012 Jun;85(1014):697-708.
doi: 10.1259/bjr/81120511. Epub 2012 Apr 11.

Watching tumours gasp and die with MRI: the promise of hyperpolarised 13C MR spectroscopic imaging

Affiliations
Review

Watching tumours gasp and die with MRI: the promise of hyperpolarised 13C MR spectroscopic imaging

K Brindle. Br J Radiol. 2012 Jun.

Abstract

A better understanding of tumour biology has led to the development of "targeted therapies", in which a drug is designed to disrupt a specific biochemical pathway important for tumour cell survival or proliferation. The introduction of these drugs into the clinic has shown that patients can vary widely in their responses. Molecular imaging is likely to play an increasingly important role in predicting and detecting these responses and thus in guiding treatment in individual patients: so-called "personalised medicine". The aim of this review is to discuss how hyperpolarised (13)C MR spectroscopic imaging might be used for treatment response monitoring. This technique, which increases the sensitivity of detection of injected (13)C-labelled molecules by >10,000-fold, has allowed a new approach to metabolic imaging. The basic principles of the technique and its potential advantages over other imaging methods for detecting early evidence of treatment response will be discussed. Given that the technique is poised to translate to the clinic, I will also speculate on its likely applications.


Figures

Figure 1
Figure 1
A patient with a primary gastrointestinal stromal tumour in the colon. The pre-treatment CT scan (a) shows a peritoneal mass (arrows), corresponding to a lesion with markedly increased fludeoxyglucose (FDG) uptake on the positron emission tomography (PET) scan (b). The CT scan (c) obtained 2 months after treatment showed that the mass had become larger; however, there was no appreciable FDG uptake seen on the FDG PET scan (d), which corresponded to clinical improvement. Reproduced with permission from Choi et al [7].
Figure 2
Figure 2
(a) The dynamic nuclear polarisation polariser and parts. 1, polariser magnet (operating at 3.35 T); 2, vacuum pump; 3, variable temperature insert (VTI); 4, microwave source; 5, pressure transducer; 6, sample port; 7, microwave cavity; 8, sample holder; 9, sample cup; 10, dissolution wand. A frozen sample to be polarised is placed in the sample cup (9) and the sample holder (8) is lowered into the VTI (3). Liquid helium from the magnet cryostat (1) is bled onto the sample using a needle valve. The sample temperature is lowered to ∼1 K by applying a vacuum and is irradiated via the microwave cavity (7) using a microwave source (4) operating at 94 GHz. When the sample is fully polarised, which can be determined by monitoring the solid-state signal (a 13C tuned coil is built into the sample holder), the sample undergoes the dissolution process. After releasing the vacuum the dissolution wand (10) is inserted into the sample holder in the VTI (3), where it engages with the sample cup (9). The sample is then lifted out of the liquid helium and discharged from the sample cup using superheated water at ∼1000 kPa (see flow arrows in 10). (b) (i) 13C spectrum of hyperpolarised urea (natural abundance 13C). The concentration of urea was 59.6 mM and the polarisation was 20%. (ii) Thermal equilibrium spectrum of the same sample at 9.4 T and room temperature. This spectrum was acquired under Ernst-angle conditions (pulse angle of 13.5° and repetition time of 1 s based on a T1 of 60 s) with 1H decoupling. The spectrum is the sum of 232 128 transients collected over 65 h. Reproduced with permission from Ardenkjaer-Larsen et al [21].
Figure 3
Figure 3
Hyperpolarised [1-13C]pyruvate exchanges the 13C label with lactate in tumour cells in vitro and in tumours in vivo. (a) Addition of non-hyperpolarised [3-13C]pyruvate to a tumour cell suspension containing added lactate, in which the 13C label was detected indirectly in the proton spectrum, demonstrated that there was exchange of label between lactate and pyruvate. The 1H spectrum allows the concentrations of both the 13C-labelled and unlabelled species to be observed and shows that there is a decrease in the concentration of 13C-labelled pyruvate and a corresponding increase in the unlabelled form (12C). (b) Addition of lactate to a tumour cell suspension together with hyperpolarised [1-13C]pyruvate increases the rate of label flux between pyruvate and lactate. This is not what you would expect if there was net flux (see c), where addition of lactate inhibits flux between pyruvate and lactate, but is what you would expect to see if there is exchange of isotope between pyruvate and lactate. The filled symbols in (c) represent experiments with 20 mM pyruvate and the open circles with 2 mM pyruvate. These experiments also demonstrate that there is pyruvate inhibition of the enzyme in spectrophotometric measurements of net flux but not in the MR spectroscopic (MRS) measurements of hyperpolarised 13C label exchange. The lack of pyruvate inhibition in the latter experiments can be explained by the higher enzyme concentration (see Witney et al [29]). (d) Exchange of hyperpolarised 13C label between endogenous lactate and the injected [1-13C]pyruvate can also be demonstrated using magnetisation transfer measurements in vivo. Inversion of the lactate polarisation produces an increase in the rate of decrease of the pyruvate signal, demonstrating unequivocally that there is label exchange, with hyperpolarised label being transferred back to pyruvate from lactate. AU, arbitrary unit. Reproduced with permission from Day et al [24], Witney et al [29] and Kettunen et al [32].
Figure 4
Figure 4
Imaging response to radiotherapy in a rat brain glioma model. A 13C chemical shift spectroscopic image obtained following the intravenous injection of hyperpolarised [1-13C]pyruvate is shown in (a), superimposed on a 1H image of tissue anatomy. The chemical shift images were obtained from a 6-mm axial slice with an in-plane resolution of 2.53×2.53 mm2. The tumour, which is readily observed in the contrast agent-enhanced image (b), was observed to increase in size following radiotherapy (lower image). However, the corresponding 13C images of pyruvate (c) and lactate (d), which were derived from spectroscopic images similar to those shown in (a), clearly show a relative decrease in lactate signal post therapy [compare signal intensities in the upper (before treatment) and lower images (after treatment)]. AU, arbitrary unit. Reproduced with permission from Day et al [39].
Figure 5
Figure 5
Non-specific binding limits the contrast that can be achieved using a targeted MR contrast agent. (a) Injection of a Gd3+ chelate-conjugated agent that binds to dead cells showed significant accumulation in a treated tumour at 24 h after injection (TA) (a), whereas a site-directed mutant of the protein, which was inactive, showed less accumulation (TI) (b). Neither the active nor inactive agent showed accumulation in the untreated tumours (UA and UI) (c, d). Co-labelling of the active agent with a fluorescent probe showed that it was bound to dying cells. (c) A fluorescence image of a histological section obtained from a treated tumour following the MRI experiment. Regions where the probe is bound, which are yellow in (c), were co-localised with regions of cell death, which are stained brown (terminal deoxynucleotidyl transferase dUTP nick end labelling stain) in (b). While the agent clearly binds to areas of cell death, it also appears to show non-specific binding to regions of viable cells and it is this that reduces the contrast-to-background ratio in the lower resolution MR images.
Figure 6
Figure 6
Monitoring the tumour microenvironment. (a) The false colour images in (iii) and (iv) show the distribution of labelled HCO3 and CO2 following intravenous injection of hyperpolarised 13C-labelled formula image 
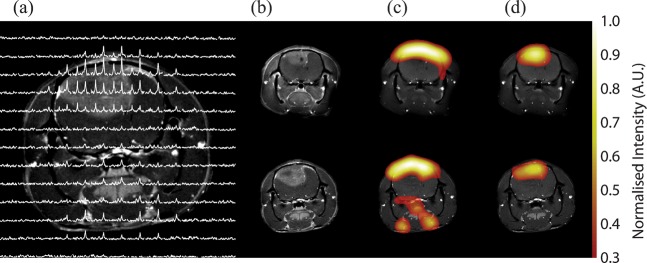
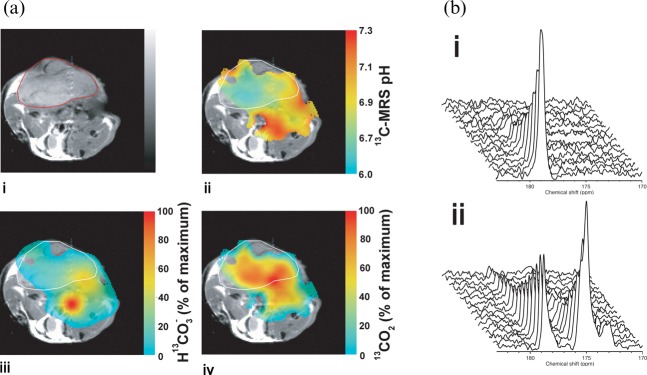
into a tumour-bearing mouse. The image resolution was 16×16 voxels, each of which measured 2×2×6 mm. The images were smoothed by multiplying by a cosine function and zero filling to 128 points in both spatial directions, line broadening to 30 Hz and then zero filling to 512 points in the spectral direction before Fourier transformation. formula image and CO2 peaks were fitted in the frequency domain and only pixels with a frequency separation between the two peaks of 36±1 ppm were included. These 13C spectroscopic images are superimposed on a 1H image of tissue anatomy (i). The tumour margin is outlined in red in (i) and in white in (ii–iv). The ratio of the CO2 (iv) and formula image 
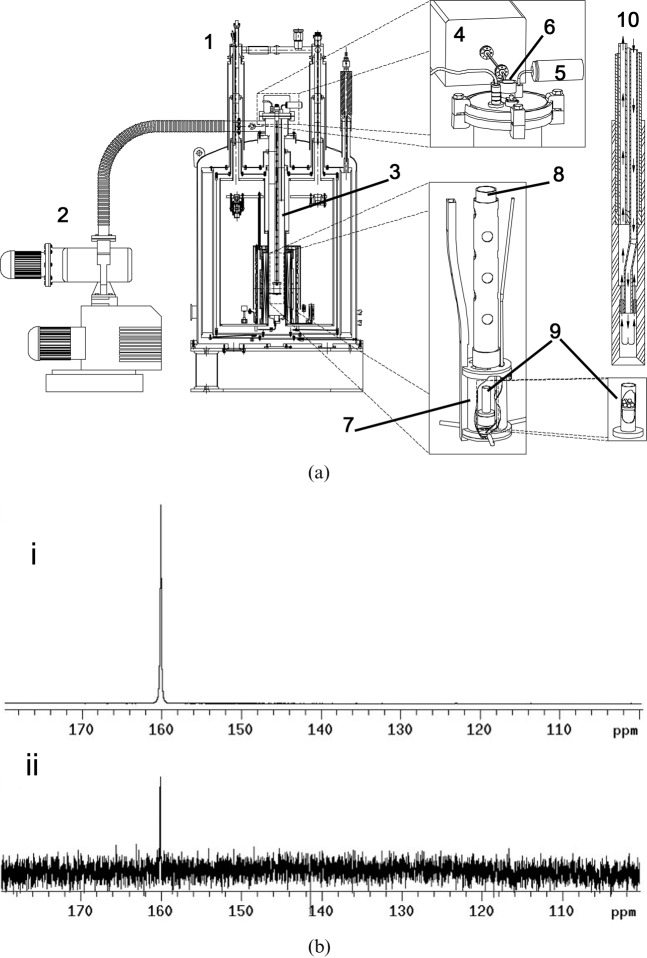
(iii) images can be used to calculate an image of extracellular pH (ii). (b) 13C MR spectra acquired from tumours following intravenous injection of [1-13C]-ascorbic acid (i) and [1-13C]-dehydroascorbic acid (ii). Sequential spectra were collected over a period of 16 s (i) and 32 s (ii). While there was no observable flux of hyperpolarised 13C label from [1-13C]-ascorbic acid (179 ppm) to [1-13C]-dehydroascorbic acid (175 ppm) (i), significant label flux was observed from [1-13C]-dehydroascorbic acid to [1-13C]-ascorbic acid, indicating rapid reduction of the injected [1-13C]-dehydroascorbic acid in the tumour. Reproduced with permission from Gallagher et al [59] and Bohndiek et al [60].

References

    1. Twombly R. Avastin's uncertain future in breast cancer treatment. J Natl Cancer Inst 103:458–60 - PubMed
    1. Sequist LV, Bell DW, Lynch TJ, Haber DA. Molecular predictors of response to epidermal growth factor receptor antagonists in non-small-cell lung cancer. J Clin Oncol 2007;25:587–95 - PubMed
    1. Sawyers CL. The cancer biomarker problem. Nature 2008;452:548–52 - PubMed
    1. Brindle K. New approaches for imaging tumour responses to treatment. Nat Rev Cancer 2008;8:94–107 - PubMed
    1. Eisenhauer E, Therasse P, Bogaerts J, Schwartz L, Sargent D, Ford R, et al. New response evaluation criteria in solid tumours: revised RECIST guideline (version 1.1). Eur J Cancer 2009;45:228–47 - PubMed

Publication types

Substances