

Inhibitors of mitochondrial Kv1.3 channels induce Bax/Bak-independent death of cancer cells
- PMID: 22496117
- PMCID: PMC3407946
- DOI: 10.1002/emmm.201200235
Inhibitors of mitochondrial Kv1.3 channels induce Bax/Bak-independent death of cancer cells
Abstract
Overcoming the resistance of tumours to chemotherapy, often due to downregulation of Bax and Bak, represents a significant clinical challenge. It is therefore important to identify novel apoptosis inducers that bypass Bax and Bak. Potassium channels are emerging as oncological targets and a crucial role of mitochondrial Kv1.3 in apoptosis has been demonstrated. Here we report for the first time that Psora-4, PAP-1 and clofazimine, three distinct membrane-permeant inhibitors of Kv1.3, induce death by directly targeting the mitochondrial channel in multiple human and mouse cancer cell lines. Importantly, these drugs activated the intrinsic apoptotic pathway also in the absence of Bax and Bak, a result in agreement with the current mechanistic model for mitochondrial Kv1.3 action. Genetic deficiency or short interfering RNA (siRNA)-mediated downregulation of Kv1.3 abrogated the effects of the drugs. Intraperitoneal injection of clofazimine reduced tumour size by 90% in an orthotopic melanoma B16F10 mouse model in vivo, while no adverse effects were observed in several healthy tissues. The study indicates that inhibition of mitochondrial Kv1.3 might be a novel therapeutic option for the induction of cancer cell death independent of Bax and Bak.
Copyright © 2012 EMBO Molecular Medicine.
Figures
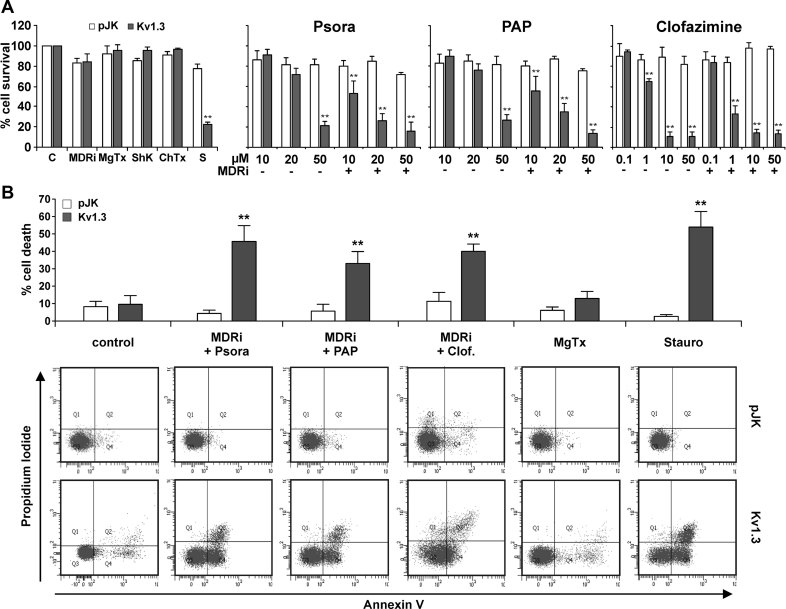
Cell viability was measured by MTT assay. Values are reported as the mean percentage of cell survival compared to untreated cells ± SD (n = 15–20; **p < 0.01). The concentration of ShK, MgTx and ChTx was 1 µM; staurosporine (S) was 1 µM; the concentrations of Psora-4, PAP-1 and clofazimine are given under the graph.
Cell death was analyzed by FACS using double staining with Annexin V and propidium iodide. Values reported in the bar-graph indicate the mean percentage ± SD of dead cells calculated taking into account Q2 and Q4 (all annexin positive cells) (n = 5). Differences between CTLL-2/pJK and CTLL-2/Kv1.3 are statistically significant (t-test, **p < 0.01) in all cases, except for control, untreated cells. The lower panel illustrates a representative experiment.
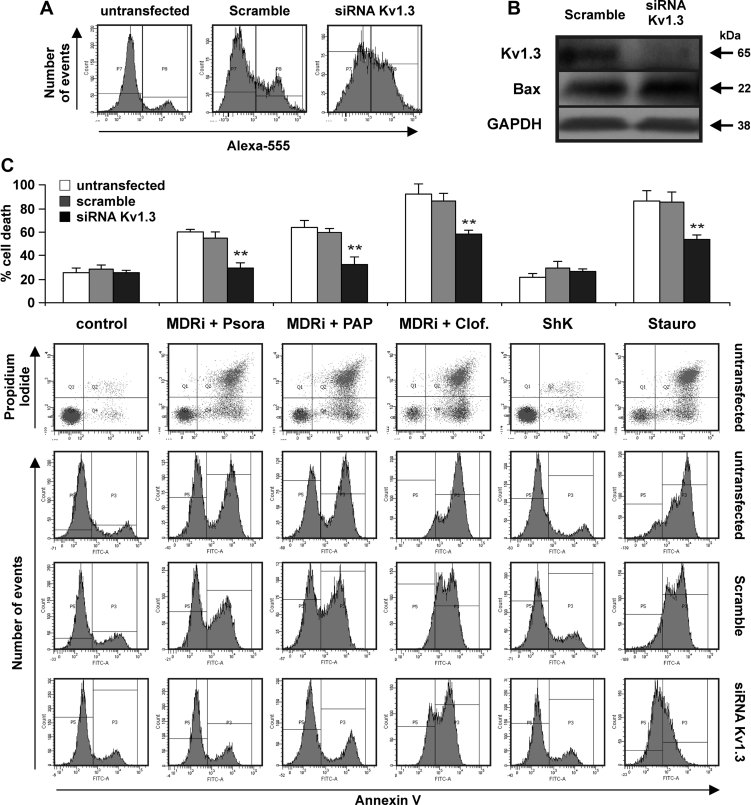
A,B. Human Jurkat leukemic T cells were electroporated with either Alexa-555 labelled siRNA control (scramble) or siRNA against Kv1.3 as described in the experimental section. After 48 h the cells were treated as indicated for 24 h (20 µM Psora and PAP-1; 1 µM clofazimine, staurosporine (Stauro) and ShK) in the presence or absence of MDR-inhibitors (MDRi). Alexa-555 fluorescence (A) and Western blot (B) are shown to evaluate siRNA transfection and protein expression, respectively (100 µg/lane of total extract). Anti-Bax and anti-GAPDH were used as loading control. The results are representative of three independent studies.
C. Upper panel: average percentages of cell death ± SD (n = 3). Asterisks indicate statistically significant differences (**p < 0.01). The lower panel displays a typical result using human Jurkat leukemic T cells from the same culture and processed together.
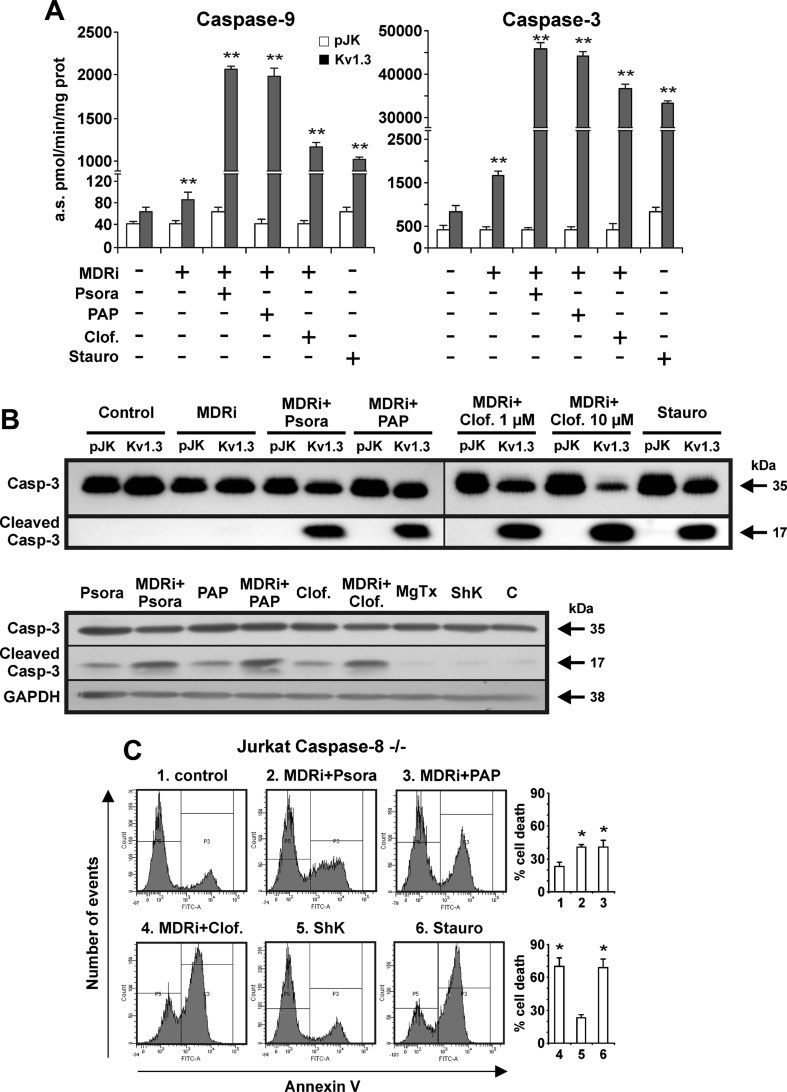
Caspase-3 and caspase-9 activities were measured as indicated in Materials and Methods Section. Four separate experiments were performed in triplicates. The values plotted are the average of 12 measurements ± SD (**p < 0.01).
Upper part: Kv1.3 inhibitors trigger caspase-3 activation as indicated by proteolytic cleavage. Shown are Western blot studies with an anti-caspase 3 antibody using the same protein extracts (100 µg/lane) as in panel A. The lower panel displays caspase 3 cleavage in 106 CTLL-2/Kv1.3 cells treated as indicated or left untreated (‘C’). Caspase 3 cleavage by Kv1.3 inhibitors is enhanced by MDRi. Glyceraldehyde 3-phosphate dehydrogenase (GAPDH) was used as loading control. The experiments were performed three times with similar results.
Caspase-8 knock-out human Jurkat leukemic T cells undergo apoptosis when treated for 24 h with staurosporine (1 µM) and membrane-permeant Kv1.3 inhibitors (MDRi: CSH 4 µM + Prob. 100 µM; 20 µM Psora and PAP-1; 1 µM clofazimine, ShK). Mean of percentages of cell death ± SD is shown (n = 3, *p < 0.05).
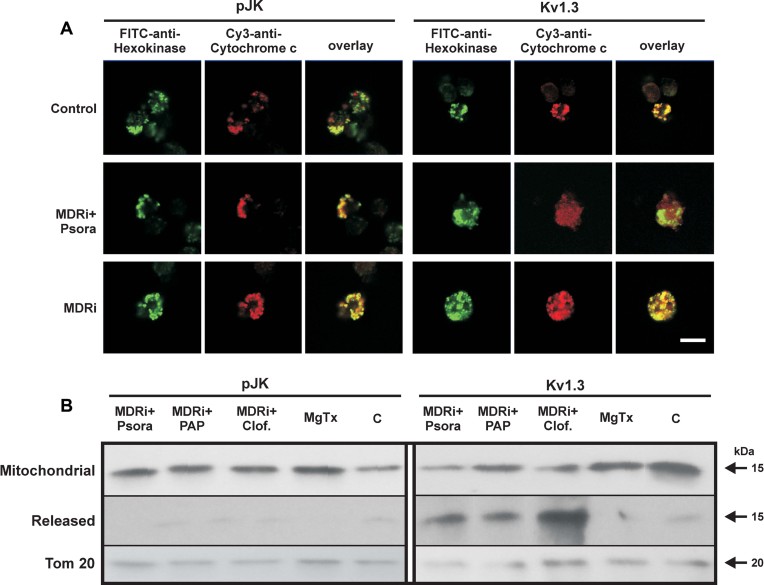
Cytochrome c release was detected in CTLL-2/pJK and CTLL-2/Kv1.3 cells by confocal microscopy following Psora-4 treatment (MDRi: CSH 1 µM + Prob. 50 µM; 20 µM Psora). Anti-hexokinase II was used to identify mitochondria. Shown is a representative result of 4 similar studies. Bar: 10 µm.
CTLL-2/pJK and CTLL-2/Kv1.3 cells were treated with the different compounds (MDRi: CSH 1 µM + Prob. 50 µM; 20 µM Psora and PAP-1; 1 µM clofazimine, MgTx) as indicated. Release of cytochrome c was detected with a specific monoclonal antibody by Western blot. Tom20 was used as loading control. The experiment was performed 3 times with similar results.
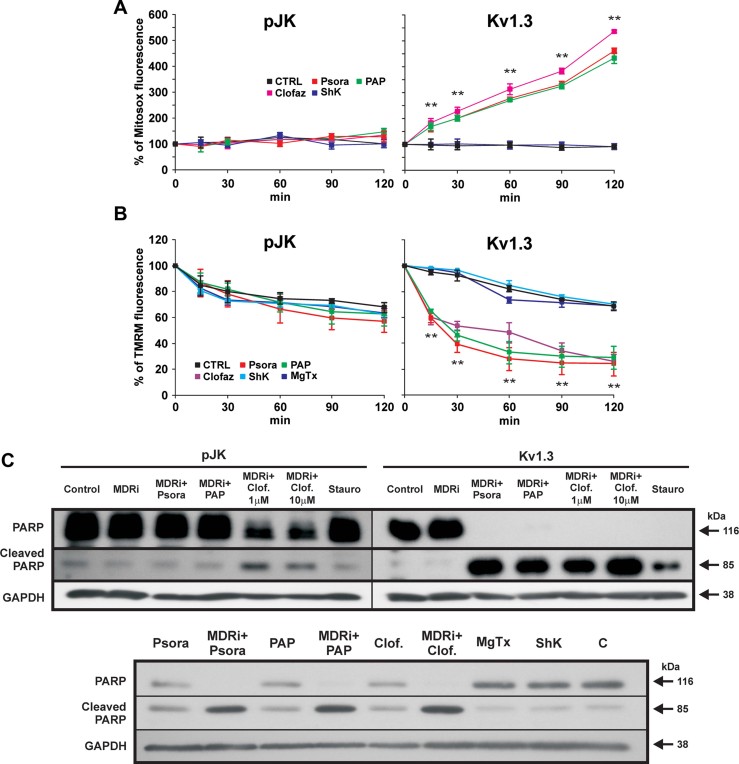
A,B. Mitosox (A) and TMRM (B) fluorescence in CTLL-2/pJK and CTLL-2/Kv1.3 cells following incubation with each 20 µM Psora or PAP-1, each 1 µM clofazimine (all added in presence of MDRi: CSH 1 µM and Prob. 50 µM), MgTx or ShK or left untreated (CTRL). Mean values ± SD are shown (n = 4, **p < 0.01, ANOVA). Mitosox detects ROS produced by mitochondria, TMRM reflects mitochondrial membrane potential.
C. PARP cleavage and activation was detected by Western blotting in the same extracts used in Fig 3B with an anti-PARP antibody (100 µg/lane). GADPH was used as loading control. Lower part: PARP activation in CTLL-2/Kv1.3 cells is more pronounced in the presence of MDRi.
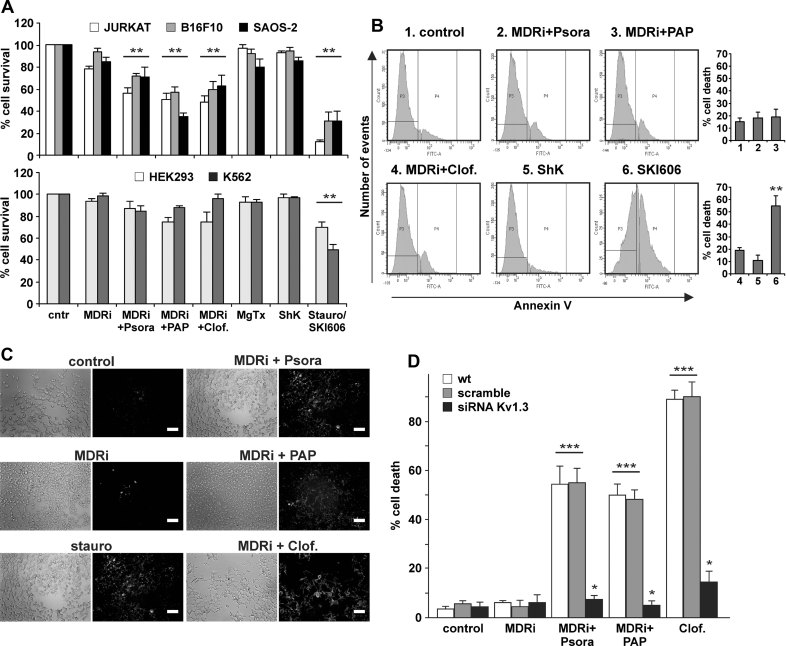
Jurkat, B16F10, SAOS-2 (upper panel) and HEK293 and K562 cells (lower panel) were incubated for 24 h as indicated (MDRi: 4 µM CSH + 100 µM Prob.; each 20 µM Psora-4 or PAP-1; each 1 µM clofazimine, MgTx, ShK or staurosporine). K562 cells are more sensitive to SKI606 (Puttini et al, 2006), an inhibitor of Src kinases, than to staurosporine, and SKI606 (5 µM) was therefore used as positive control. MTT assay was performed to determine cell survival. Data are shown as mean changes in percent compared to untreated cells ± SD (n = 12; **p < 0.01).
Representative FACS analysis performed on K562 cells lacking Kv1.3 treated as in panel A. Right panel: average % of cell death ± SD is shown (n = 3; **p < 0.01).
Annexin V binding in SAOS-2 cells after treatment with the different Kv1.3 inhibitors at the concentrations used in panel A shown by fluorescence microscopy. The result shown is representative of four other experiments giving similar results. Bar: 100 µm (except for MDRi + Clof, where bar is 50 µm).
B16F10 melanoma cells die by apoptosis as assayed by FACS analysis after FITC-Annexin V staining. Furthermore, TUNEL staining after a 24 h treatment of B16F10 melanoma cells with Kv1.3 inhibitors confirmed apoptosis in B16F10 cells after Kv1.3 inhibition (data not shown). Suppression of Kv1.3 expression by transfection of siRNA targeting Kv1.3 prevents cell death by Kv1.3 inhibitors. B16F10 cells were treated as indicated for panel A. Given is the mean of the percentage of dead cells ± SD (n = 4; *p < 0.05, ***p < 0.001).
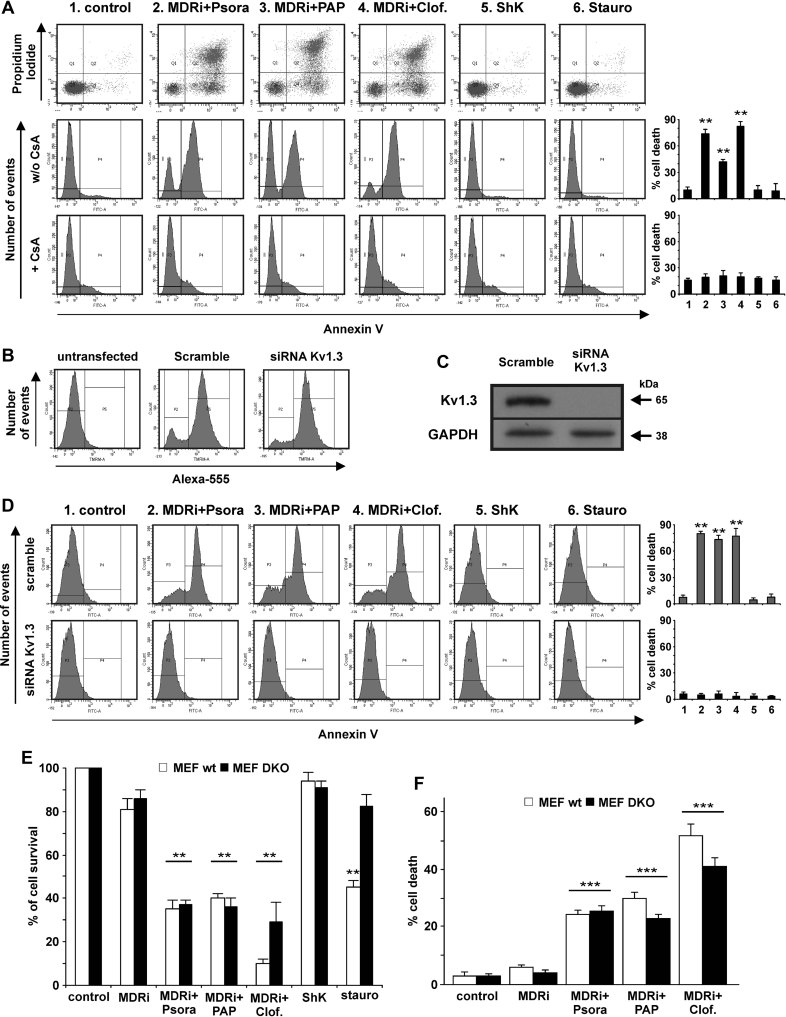
A. Bax/Bak-deficient human Jurkat leukemic T cells are resistant to apoptosis induced by staurosporine, but are sensitive to Psora-4, PAP-1 and clofazimine (each 20 µM Psora-4 or PAP-1; each 1 µM clofazimine, ShK or staurosporine; MDRi: 4 µM CSH + 100 µM Prob.). These effects are abolished by preincubation with Cyclosporine A (CsA; 4 µM for 30 min) blocking the permeability transition pore (lower row). Average % of cell death ± SD is shown (n = 3; **p < 0.01).
B–D. Bax/Bak-deficient human Jurkat leukemic T cells were electroporated with either Alexa-555 labelled siRNA control (scramble) or siRNA against Kv1.3 as described in the experimental section. After 48 h the cells were treated as indicated in panel A for 24 h. Alexa-555 fluorescence (B) and Western blot (C) are shown to evaluate siRNA transfection and protein expression, respectively (100 µg/lane of total extract). Anti-GAPDH was used as loading control. The results are representative for three independent studies. (D) Cell death was measured by FACS analysis after FITC-Annexin-V staining. In the plots are shown average percentages of cell death ± SD (n = 3; **p < 0.01).
E,F. MTT assays (E) and TUNEL (F) on wildtype and Bax/Bak-deficient DKO MEFs indicate that permeant Kv1.3 inhibitors induce death independent of Bax and Bak expression (doses as in panel A). Apoptosis was confirmed also by Annexin-V staining, giving the same results (data not shown). Shown is the mean of the percentages of cell survival ± SD compared to untreated samples (n = 3; **p < 0.01, ***p < 0.001).
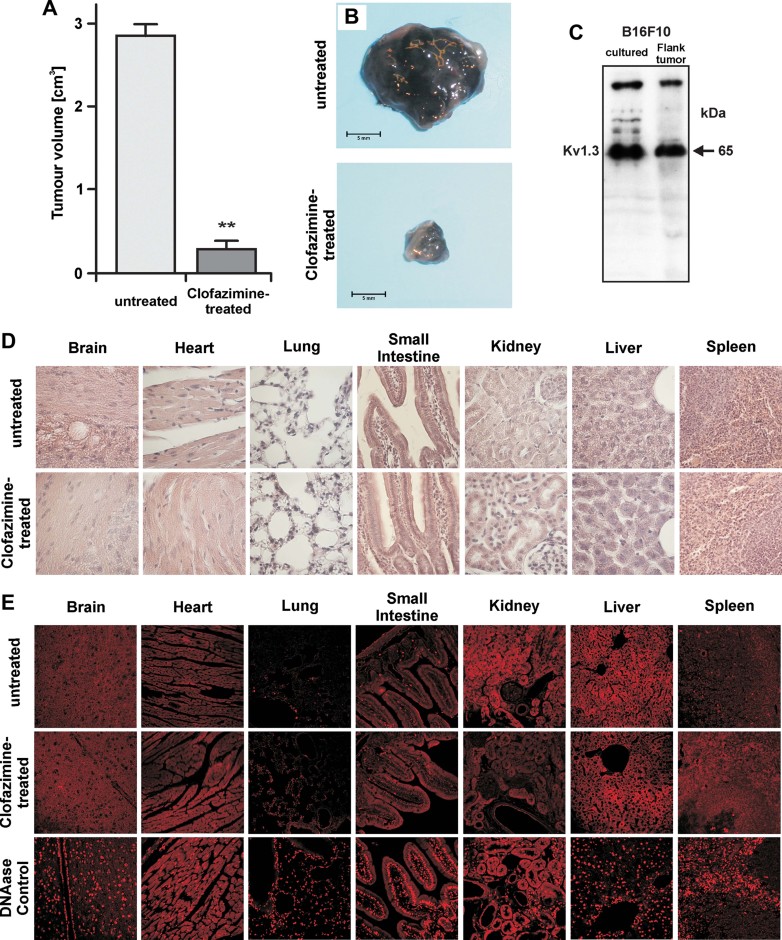
A. Mean ± SD of the volume of the tumours after 16 days of growth in untreated (n = 8) and treated (n = 8) mice (**p < 0.01).
B. Representative tumours.
C. Cultured B16F10 cells or B16F10 melanoma were lysed, separated by 7.5% SDS–PAGE and Western blotted with anti-Kv1.3 antibodies. The results show expression of Kv1.3 in B16F10 cells in vitro and an in vivo.
D,E. Haematoxylin/eosin (D) and TUNEL (E) staining from the brain, heart, lungs, small intestine, kidney, liver and spleen display no gross abnormalities in these organs after clofazimine treatment. Displayed are representative histologies from each three independent studies.
References
-
- Abdul M, Hoosein N. Voltage-gated potassium ion channels in colon cancer. Oncol. Rep. 2002;9:961–964. - PubMed
-
- Abdul M, Hoosein N. Reduced Kv 1.3 potassium channel expression in human prostate cancer. J. Membr. Biol. 2006;214:99–102. - PubMed
-
- Abdul M, Santo A, Hoosein N. Activity of potassium channel blockers in breast cancer. Anticancer Res. 2003;23:3347–3351. - PubMed
-
- Alizadeh AA, Eisen MB, Davis RE, Ma C, Lossos IS, Rosenwald A, Boldrick JC, Sabet H, Tran T, Yu X. Distinct types of diffuse large B-cell lymphoma identified by gene expression profiling. Nature. 2000;403:503–511. - PubMed
Publication types
MeSH terms
Substances
LinkOut - more resources
Full Text Sources
Other Literature Sources
Research Materials
