. 2012 Aug;11(8):329-41.
doi: 10.1074/mcp.O111.013706. Epub 2012 Apr 10.

A human ubiquitin conjugating enzyme (E2)-HECT E3 ligase structure-function screen

Affiliations

A human ubiquitin conjugating enzyme (E2)-HECT E3 ligase structure-function screen

Yi Sheng et al. Mol Cell Proteomics. 2012 Aug.

Abstract

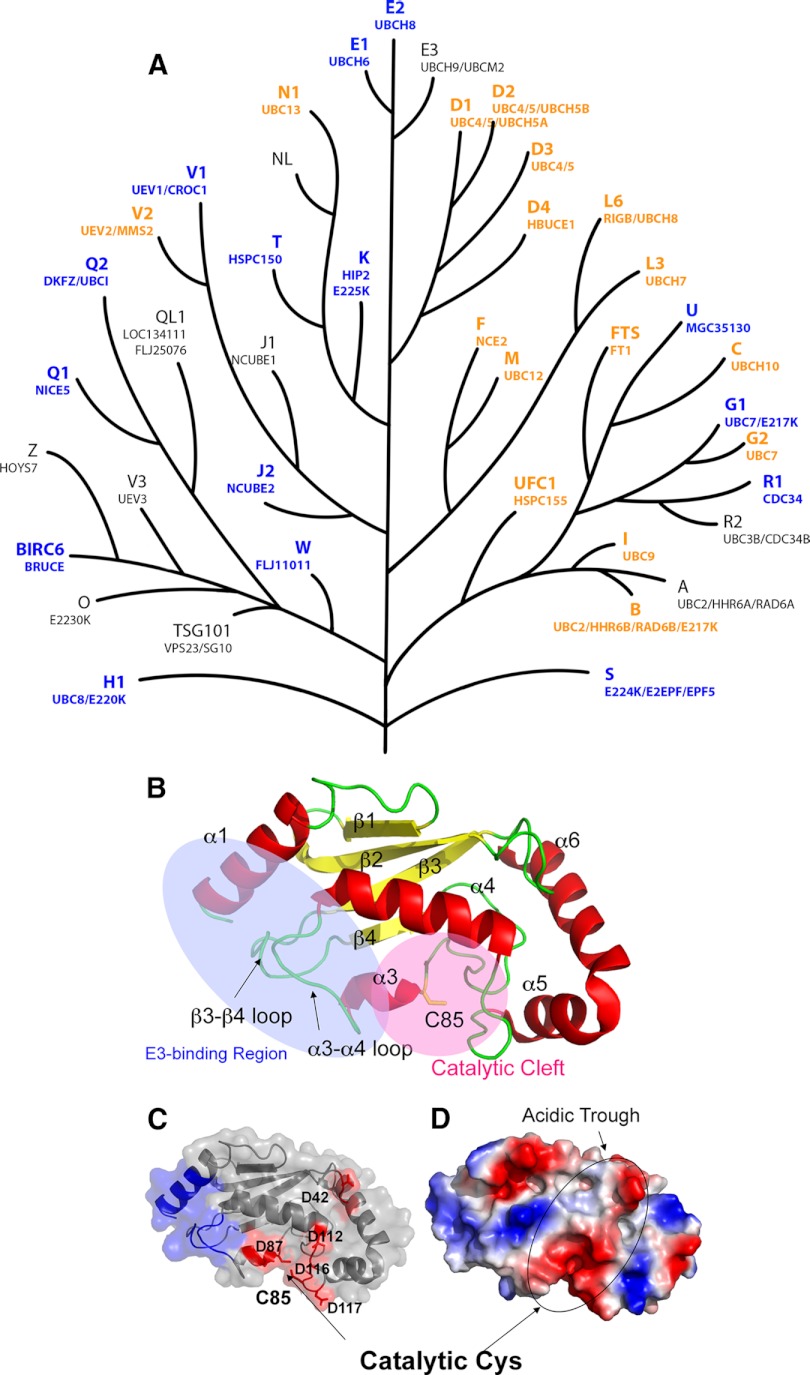
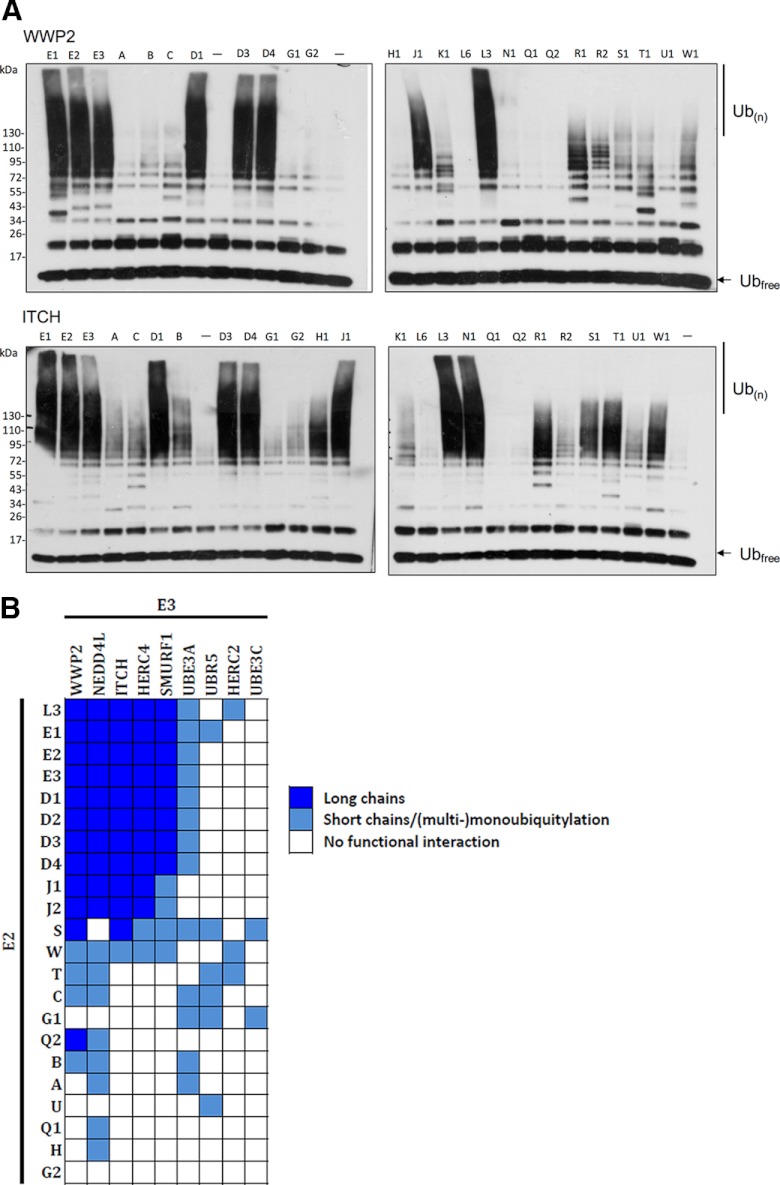
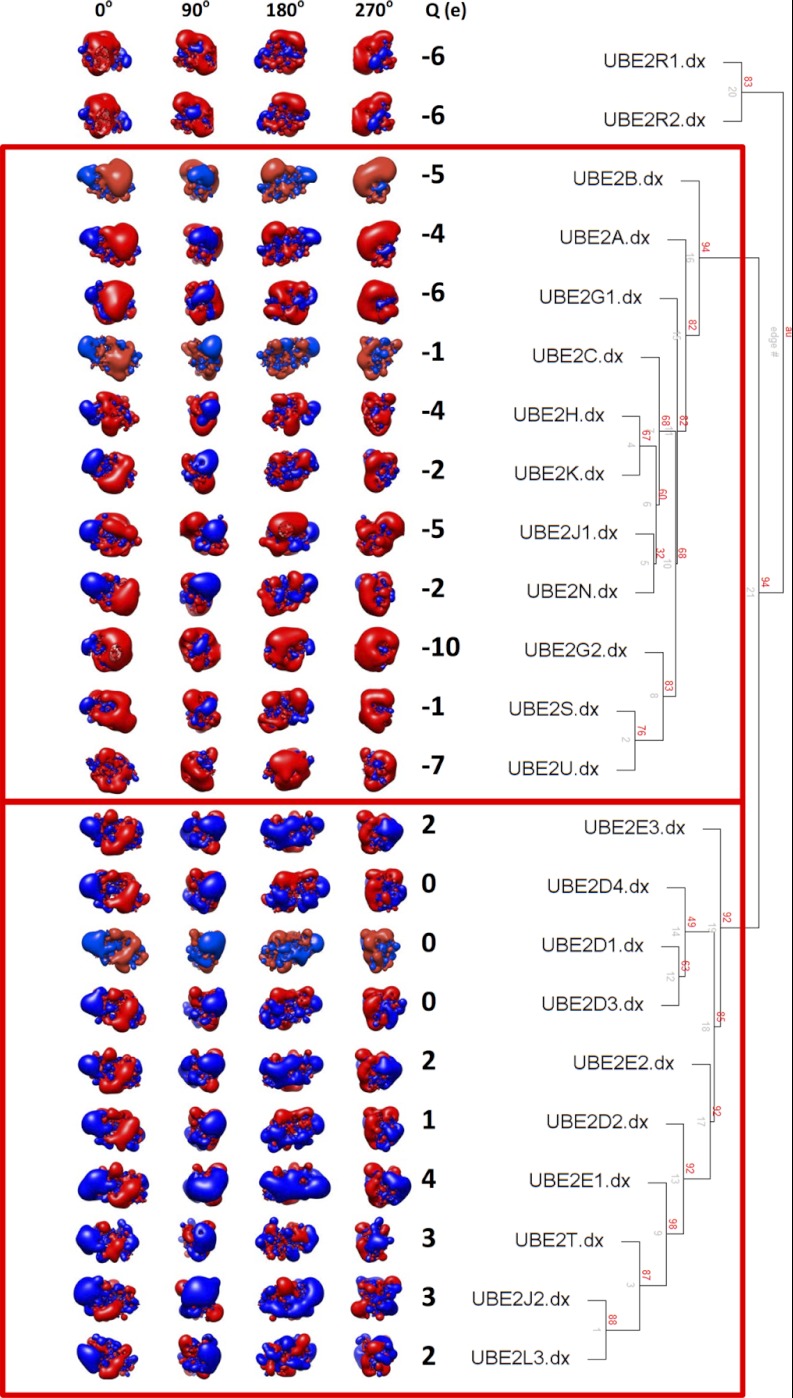
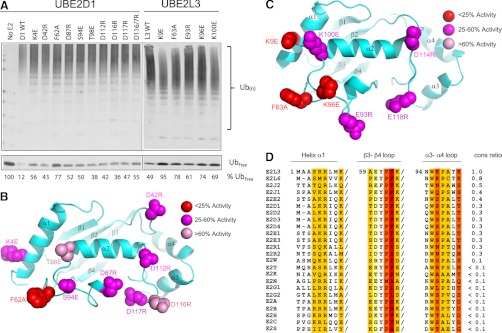
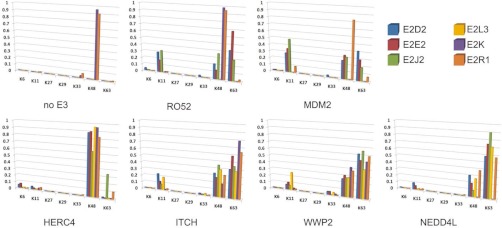
Here we describe a systematic structure-function analysis of the human ubiquitin (Ub) E2 conjugating proteins, consisting of the determination of 15 new high-resolution three-dimensional structures of E2 catalytic domains, and autoubiquitylation assays for 26 Ub-loading E2s screened against a panel of nine different HECT (homologous to E6-AP carboxyl terminus) E3 ligase domains. Integration of our structural and biochemical data revealed several E2 surface properties associated with Ub chain building activity; (1) net positive or neutral E2 charge, (2) an "acidic trough" located near the catalytic Cys, surrounded by an extensive basic region, and (3) similarity to the previously described HECT binding signature in UBE2L3 (UbcH7). Mass spectrometry was used to characterize the autoubiquitylation products of a number of functional E2-HECT pairs, and demonstrated that HECT domains from different subfamilies catalyze the formation of very different types of Ub chains, largely independent of the E2 in the reaction. Our data set represents the first comprehensive analysis of E2-HECT E3 interactions, and thus provides a framework for better understanding the molecular mechanisms of ubiquitylation.


Figures

Fig. 1.
Fig. 1.
The UBC domain. A, Dendrogram of human UBC domains, depicting putative evolutionary relationships. A phylogenetic tree was generated from a cladogram derived from a ClustalW2 alignment of the minimal UBC fold. Nodal distances and relationships have been modified for clarity. NCBI gene nomenclature is shown above in larger font, and aliases below. Protein structures solved in this study are colored blue, and previously published structures are depicted in orange. B, Ribbon diagram of UBE2D1 (PDBID: 2C4P). Helices are labeled as α1-α6, and strands as β1-β4. Helix α2 is not observed in UBE2D1, but contained in the structures of UBE2Q1 (2QGX) and UBE2Q2 (1ZUO), and is located between β2 and β3. The E3 ligase binding region (blue) and the catalytic cleft (pink) encompassing Cys85 at the active site are also indicated. C, A surface and ribbon representation of UBE2D1, with the E3-binding region colored in blue. Acidic residues on the negatively charged surface are also indicated. D, An electrostatic surface representation of UBE2D1 in the same orientation. Locations of the acidic trough and catalytic Cys residue are indicated.
Fig. 2.
Fig. 2.
Autoubiquitylation reactions. A, Autoubiquitylation was performed in the presence of recombinant E1, ATP, ubiquitin and E2. Reactions were subjected to SDS-PAGE and anti-Ub Western analysis. Shown is a representative screen (with the HECT E3 domains of WWP2 and ITCH), typical of results obtained in three independent experiments. Each lane represents an individual autoubiquitylation reaction with E2 indicated at top. (-) indicates negative control, lacking E2 protein. The locations of unconjugated and oligomeric His-Ub are indicated to the right of each Western blot. B, A heat map depicting Ub chain-building activity of each of the 234 E2-E3 pairs in in vitro autoubiquitylation reactions. Dark blue indicates long Ub chains (>125 kDa), light blue indicates short chains or (multi-) monoubiquitylation, and white indicates no functional interaction. E2s and E3s are hierarchically clustered according to activity.
Fig. 3.
Fig. 3.
left - Spatial distributions of electrostatic potentials of human E2 protein structures; red = acidic, blue = basic at ± 1kBT/e. Four different orientations around the vertical axis are shown, along with net charge (Q(e)) of the full structure. right - An agglomerative hierarchical clustering dendrogram was generated using pvclust, calculated based on the spatial distribution of electrostatic potential within 6Å of the ubiquitin donor interaction interface. Bootstrap probability values (red), and edge numbers (gray) are indicated.
Fig. 4.
Fig. 4.
Defining residues important for E2-HECT function. A, Mutational analysis of the UBE2D1 acidic trough and UBE2L3 HECT binding domain. (top) E2 proteins bearing single point mutations (as indicated) were assayed in a standard autoubiquitylation assay. Percentage unconjugated (free) Ub is indicated below each reaction. (bottom) B, UBE2D1 ribbon diagram highlighting the locations of each of the mutated residues in the E2 structure, color coded according to magnitude of effect on Ub conjugation in vitro. C, UBE2L3 ribbon diagram highlighting locations of mutated residues. D, Alignment of the previously defined UBE2L3 HECT binding domain with other Ub-loading human E2 sequences. Residues previously found to play a role in HECT binding are highlighted. Column color corresponds to the change in binding energy observed when this residue was mutated (39). A “conservation score” for each E2 was assigned as follows; identical residues were assigned a score according to binding energy, where: red residues = +4, orange = +3, mustard = +2, light yellow = +1; conserved mutations at the same location (e.g. R to K, or S to T) were assigned half scores. Similar amino acids (e.g. aliphatic, charged or small amino acids) were assigned a score of 0. Dramatically altered amino acids at the same position were penalized with a negative score corresponding to the binding energy of each UBE2L3 amino acid. Raw scores were summed for each E2, and conservation score determined by dividing by the E2L3 score of 32.
Fig. 5.
Fig. 5.
Ub linkage analysis. Autoubiquitylation reactions were subjected to SDS-PAGE, and reaction products analyzed by mass spectrometry (see Methods for details). Ub linkage composition for each E2-E3 reaction are presented as a fraction of the total number of linkages detected. See Legend inset for color codes.

References

    1. Schwartz A. L., Ciechanover A. (2009) Targeting proteins for destruction by the ubiquitin system: implications for human pathobiology. Annu. Rev. Pharmacol. Toxicol. 49, 73–96 - PubMed
    1. Deshaies R. J., Joazeiro C. A. (2009) RING domain E3 ubiquitin ligases. Annu. Rev. Biochem. 78, 399–434 - PubMed
    1. Finley D. (2009) Recognition and processing of ubiquitin-protein conjugates by the proteasome. Annu. Rev. Biochem. 78, 477–513 - PMC - PubMed
    1. Pickart C. M., Eddins M. J. (2004) Ubiquitin: structures, functions, mechanisms. Biochim. Biophys. Acta 1695, 55–72 - PubMed
    1. Pickart C. M., Fushman D. (2004) Polyubiquitin chains: polymeric protein signals. Curr. Opin. Chem. Biol. 8, 610–616 - PubMed

Publication types

MeSH terms

LinkOut - more resources