. 2012 Jun;302(11):R1327-39.
doi: 10.1152/ajpregu.00477.2011. Epub 2012 Apr 11.

Changes in glucose tolerance and leptin responsiveness of rats offered a choice of lard, sucrose, and chow

Affiliations

Changes in glucose tolerance and leptin responsiveness of rats offered a choice of lard, sucrose, and chow

Ruth B S Harris et al. Am J Physiol Regul Integr Comp Physiol. 2012 Jun.

Abstract

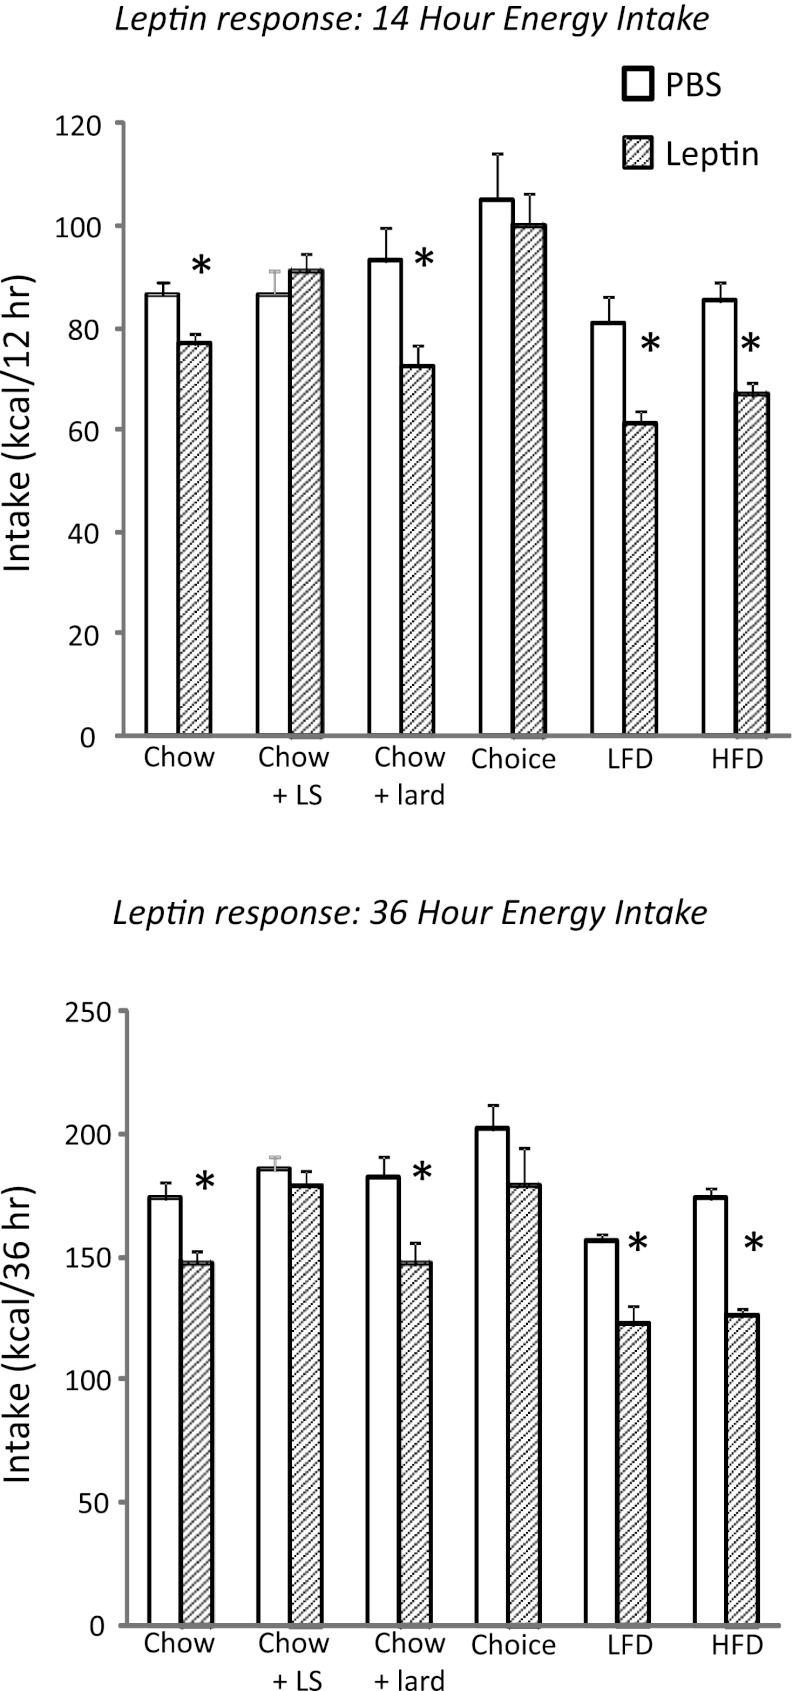
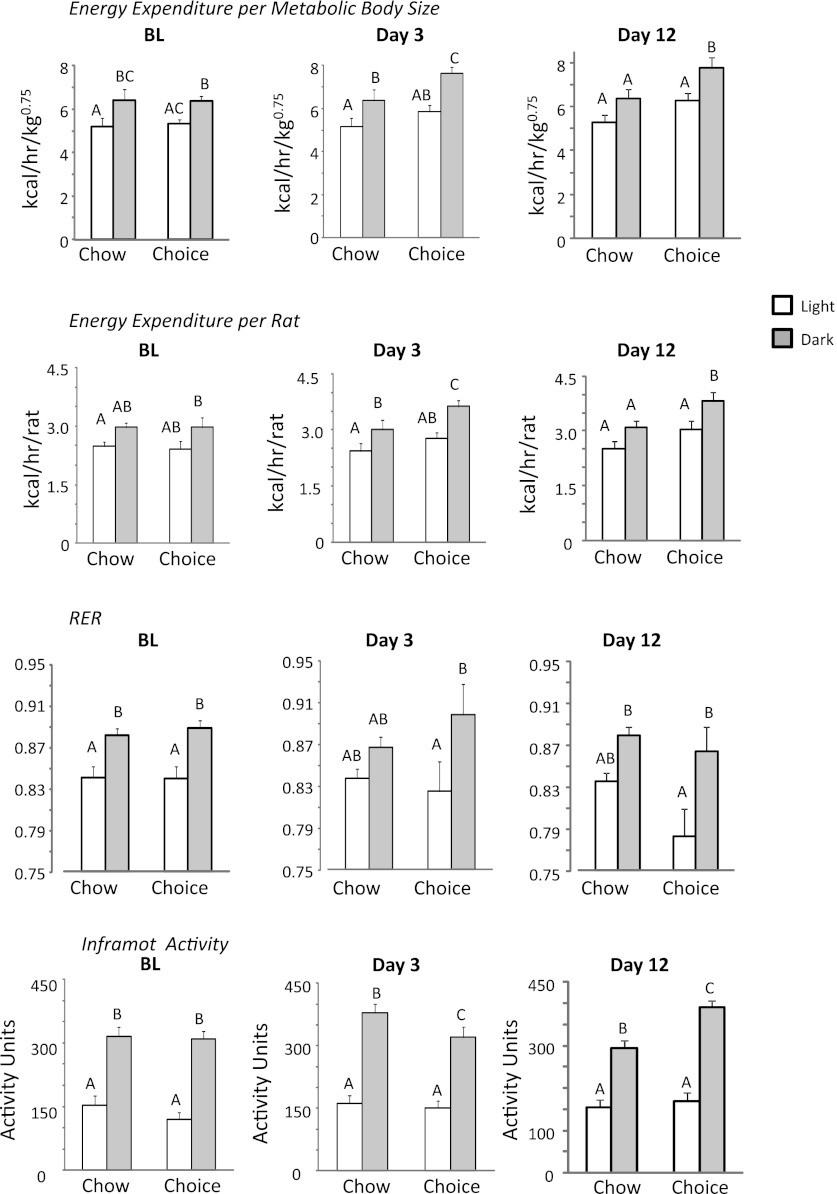
Rats offered chow, lard, and 30% sucrose solution (choice) rapidly become obese. We tested metabolic disturbances in rats offered choice, chow+lard, or chow+30% sucrose solution [chow+liquid sucrose (LS)] and compared them with rats fed a composite 60% kcal fat, 7% sucrose diet [high-fat diet (HFD)], or a 10% kcal fat, 35% sucrose diet [low-fat diet (LFD)]. Choice rats had the highest energy intake, but HFD rats gained the most weight. After 23 days carcass fat was the same for choice, HFD, chow+lard, and chow+LS groups. Glucose clearance was the same for all groups during an intraperitoneal glucose tolerance test (GTT) on day 12, but fasting insulin was increased in choice, LFD fed, and chow+LS rats. By contrast, only choice and chow+LS rats were resistant to an intraperitoneal injection of 2 mg leptin/kg on day 17. In experiment 2 choice rats were insulin insensitive during an intraperitoneal GTT, but this was corrected in an oral GTT due to GLP-1 release. UCP-1 protein was increased in brown fat and inguinal white fat in choice rats, and this was associated with a significant increase in energy expenditure of choice rats during the dark period whether expenditure was expressed on a per animal or a metabolic body size basis. The increase in expenditure obviously was not great enough to prevent development of obesity. Further studies are required to determine the mechanistic basis of the rapid onset of leptin resistance in choice rats and how consumption of sucrose solution drives this process.


Figures

Fig. 1.
Fig. 1.
Daily body weights (top), food intakes (middle), and weight gain over 23 days (lower) in experiment 1. Data are means ± SE for groups of 10 rats. LS, liquid sucrose; LFD, low-fat diet; HFD, high-fat diet; GTT, glucose tolerance test. Different superscript letters in the bottom panel indicate significant differences between groups (P < 0.05).
Fig. 2.
Fig. 2.
Results from intraperitoneal GTT performed on day 12 of experiment 1. There was no effect of diet on serum glucose during the GTT. *Significant differences in insulin at time 0 and 15 min. Top shows fasting insulin and values that do not share a common superscript are significantly different at P < 0.05. Data are means ± SE for groups of 10 rats.
Fig. 3.
Fig. 3.
Leptin responsiveness of rats tested on day 21 of experiment 1. *Significant effect of leptin on food intake for a specific dietary group. Data are means + SE for groups of 10 rats.
Fig. 4.
Fig. 4.
UCP-1 protein in intrascapular brown adipose tissue (IBAT), inguinal (Ing), and retroperitoneal (RP) fat of rats in experiment 1. The protein is expressed as a ratio of UCP-1 to actin determined by Western blot. Values for IBAT UCP-1 that do not share a common superscript letter are significantly different at P < 0.05. Data are means + SE for groups of 10 rats.
Fig. 5.
Fig. 5.
Energy intake and body weights of rats in experiment 2. Data are means ± SE for groups of 10 rats. *Days on which choice rats weighed significantly more than their chow controls.
Fig. 6.
Fig. 6.
Results from the intraperitoneal (ip) and oral glucose tolerances performed on rats in experiment 2. Top: results from the ip GTT performed on day 12; middle: results from the oral GTT performed on day 17. *Time points at which glucose or insulin are significantly different between choice and control rats. Bottom: glucagon-like peptide (GLP-1) release in response to oral glucose and area under the curve (AUC) for the two GTT tests. Values on a specific axis that do not share a common superscript are significantly different at P < 0.05. Data are means ± SE for groups of 10 rats.
Fig. 7.
Fig. 7.
UCP-1 protein (top) and mRNA (bottom) expression in white and brown fat of choice and chow-fed rats in experiment 2. *Significant effects of diet. Data are means + SE for groups of 10 rats.
Fig. 8.
Fig. 8.
Energy expenditure, respiratory exchange ratio (RER), and activity of rats housed in the calorimeter in experiment 3. Three different time points are represented: BL is baseline before rats were offered choice diet. Day 3 represents measurements from the third day that the rats were offered choice diet. Day 12 is the 12th day that the rats were offered choice diet. Open bars show average measures for the light phase (7:00 AM-7:00 PM); filled bars represent measures for the dark period. Rats were housed in the calorimeter but measurements were taken only from the third day for each of the time periods. Data are means + SE for groups of 8 rats. Values on a specific axis that do not share a common superscript are significantly different at P < 0.05.

References

    1. Ackerman Z, Oron-Herman M, Grozovski M, Rosenthal T, Pappo O, Link G, Sela BA. Fructose-induced fatty liver disease: hepatic effects of blood pressure and plasma triglyceride reduction. Hypertension 45: 1012–1018, 2005 - PubMed
    1. Alzamendi A, Giovambattista A, Raschia A, Madrid V, Gaillard RC, Rebolledo O, Gagliardino JJ, Spinedi E. Fructose-rich diet-induced abdominal adipose tissue endocrine dysfunction in normal male rats. Endocrine 35: 227–232, 2009 - PubMed
    1. Aplozan JW, Harris RBS. The effects of diet on consumption of scurose solution and lard and th development of obesity. Appetite 54: 631, 2010
    1. Apolzan JW, Harris RB. Differential effects of chow and purified diet on the consumption of sucrose solution and lard and the development of obesity. Physiol Behav 105: 325–331, 2012 - PMC - PubMed
    1. Axelsen LN, Lademann JB, Petersen JS, Holstein-Rathlou NH, Ploug T, Prats C, Pedersen HD, Kjolbye AL. Cardiac and metabolic changes in long-term high fructose-fat fed rats with severe obesity and extensive intramyocardial lipid accumulation. Am J Physiol Regul Integr Comp Physiol 298: R1560–R1570, 2010 - PubMed

Publication types