. 2012 Jul;40(7):1366-79.
doi: 10.1124/dmd.112.045112. Epub 2012 Apr 11.

Coordinated regulation of hepatic phase I and II drug-metabolizing genes and transporters using AhR-, CAR-, PXR-, PPARα-, and Nrf2-null mice

Affiliations

Coordinated regulation of hepatic phase I and II drug-metabolizing genes and transporters using AhR-, CAR-, PXR-, PPARα-, and Nrf2-null mice

Lauren M Aleksunes et al. Drug Metab Dispos. 2012 Jul.

Abstract

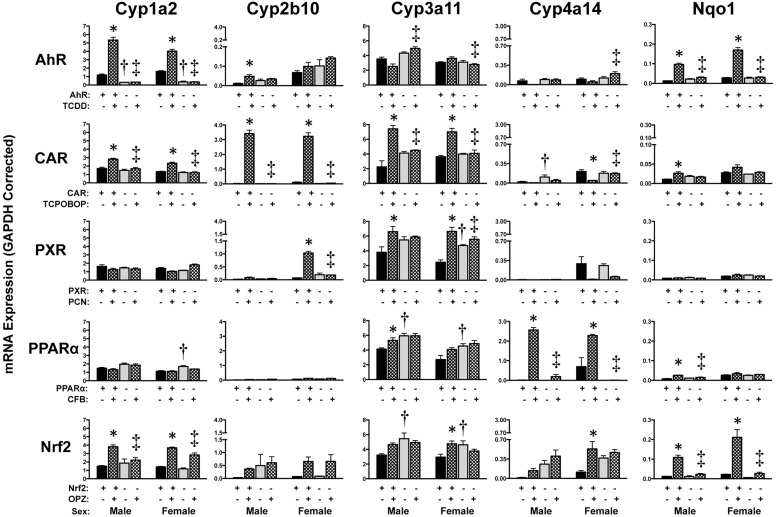
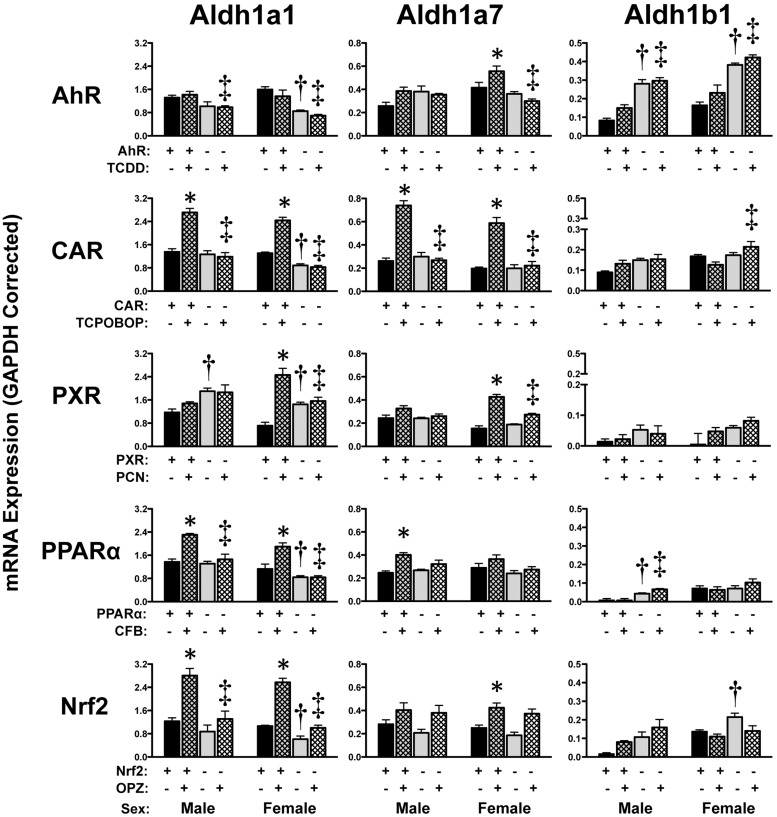
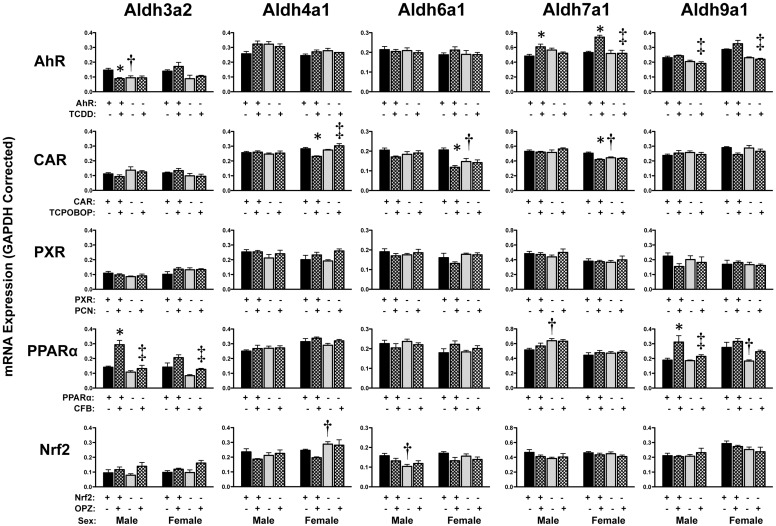
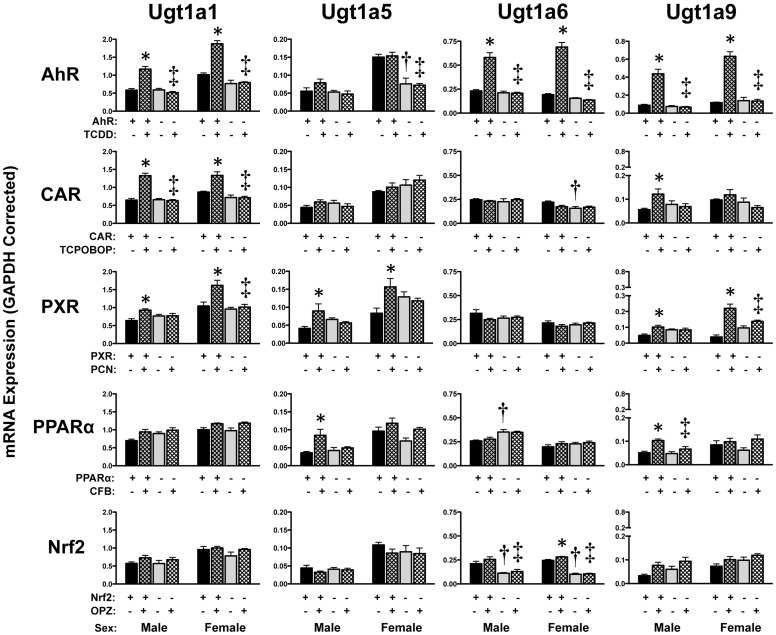
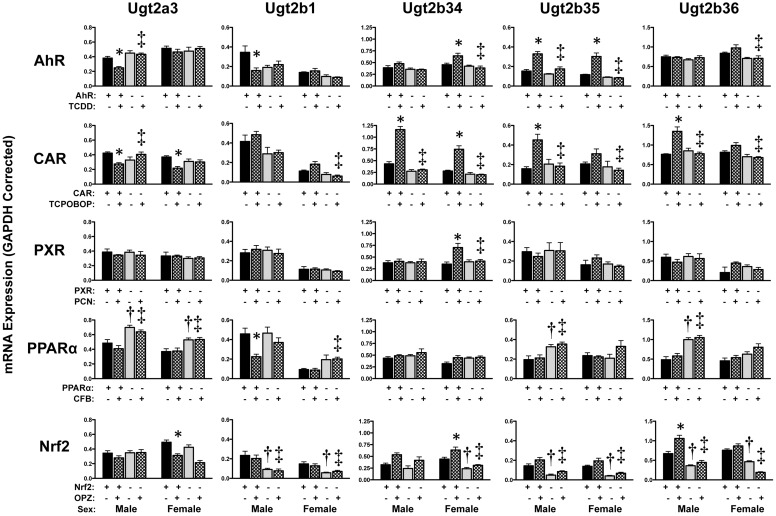
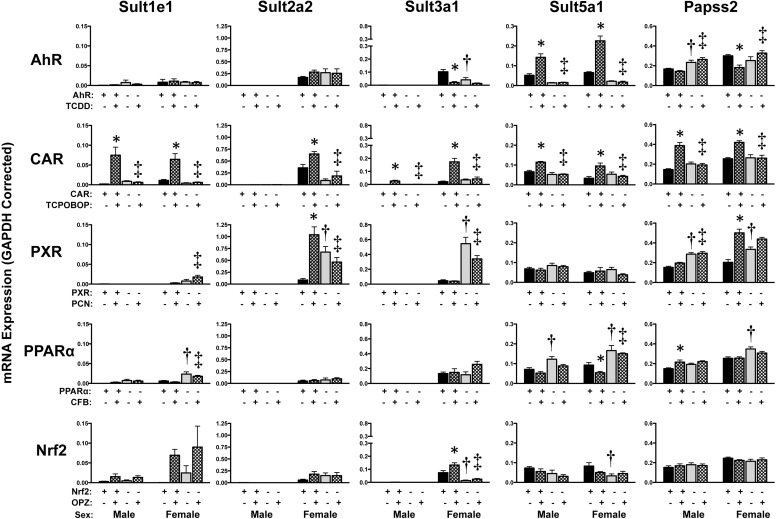
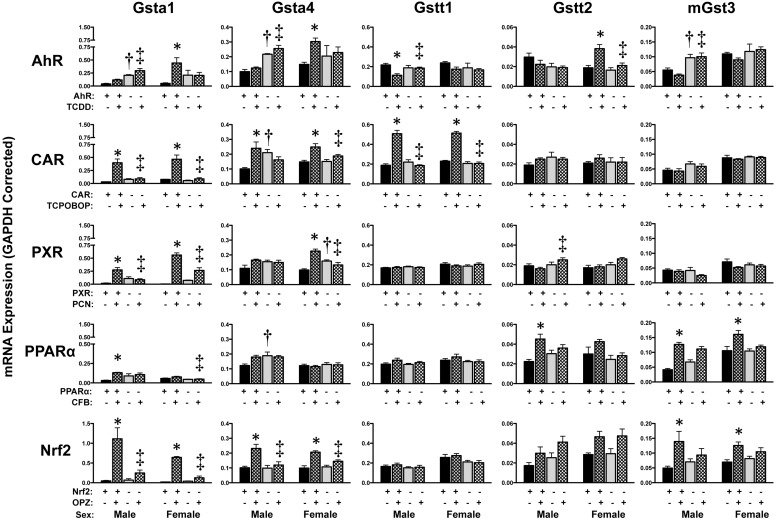
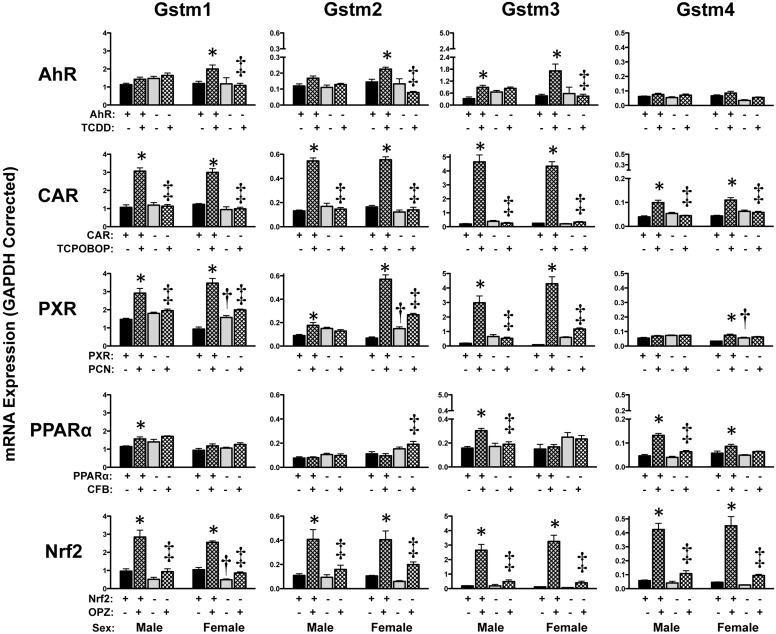
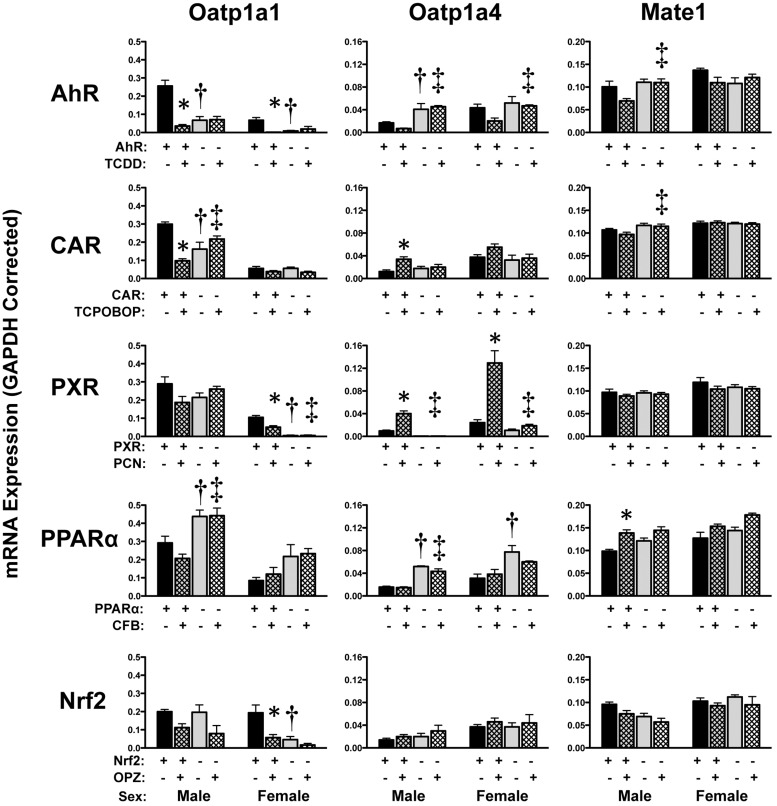
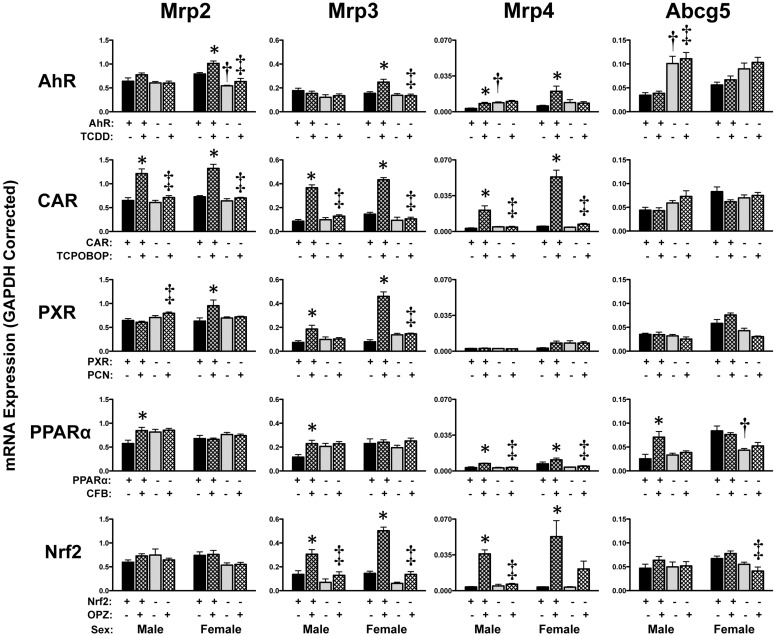
The transcription factors aryl hydrocarbon receptor (AhR), constitutive androstane receptor (CAR), pregnane X receptor (PXR), peroxisome proliferator-activated receptor α (PPARα), and nuclear factor erythroid 2-related factor 2 (Nrf2) regulate genes encoding drug-metabolizing enzymes and transporters in livers of mice after chemical activation. However, the specificity of their transcriptional regulation has not been determined systematically in vivo. The purpose of this study was to identify genes encoding drug-metabolizing enzymes and transporters altered by chemical activators in a transcription factor-dependent manner using wild-type and transcription factor-null mice. Chemical activators were administered intraperitoneally to mice once daily for 4 days. Livers were collected 24 h after the final dose, and total RNA was isolated for mRNA quantification of cytochromes P450, NAD(P)H quinone oxidoreductase 1 (Nqo1), aldehyde dehydrogenases (Aldhs), glutathione transferases (Gsts), sulfotransferases (Sults), UDP-glucuronosyltransferases (Ugts), organic anion-transporting polypeptides (Oatps), and multidrug resistance-associated proteins (Mrps). Pharmacological activation of each transcription factor leads to mRNA induction of drug metabolic and transport genes in livers of male and female wild-type mice, but no change in null mice: AhR (Cyp1a2, Nqo1, Aldh7a1, Ugt1a1, Ugt1a6, Ugt1a9, Ugt2b35, Sult5a1, Gstm3, and Mrp4), CAR (Cyp2b10, Aldh1a1, Aldh1a7, Ugt1a1, Ugt2b34, Sult1e1, Sult3a1, Sult5a1, Papps2, Gstt1, Gsta1, Gsta4, Gstm1-4, and Mrp2-4), PXR (Cyp3a11, Ugt1a1, Ugt1a5, Ugt1a9, Gsta1, Gstm1-m3, Oatp1a4, and Mrp3), PPARα (Cyp4a14, Aldh1a1, mGst3, Gstm4, and Mrp4), and Nrf2 (Nqo1, Aldh1a1, Gsta1, Gsta4, Gstm1-m4, mGst3, and Mrp3-4). Taken together, these data reveal transcription factor specificity and overlap in regulating hepatic drug disposition genes by chemical activators. Coordinated regulation of phase I, phase II, and transport genes by activators of transcription factors can have implications in development of pharmaceuticals as well as risk assessment of environmental contaminants.


Figures

Fig. 1.
Fig. 1.
Hepatic mRNA expression of cytochrome P450 enzymes in livers of wild-type and transcription factor-null mice after chemical activation. mRNA expression was quantified using total hepatic RNA from control and inducer-treated wild-type and transcription factor-null mice on day 5. Data were normalized to glyceraldehyde 3-phosphate dehydrogenase (GAPDH) mRNA and are presented as mean relative expression ± S.E. For each graph, males are on the left and females are on the right. *, statistically significant difference (p < 0.05) compared with control mice of that genotype. †, statistically significant difference (p < 0.05) between wild-type and null control mice. ‡, statistically significant difference (p < 0.05) between wild-type and null inducer-treated mice.
Fig. 2.
Fig. 2.
Hepatic mRNA expression of Aldh family 1 enzymes in livers of wild-type and transcription factor-null mice after chemical activation. mRNA expression was quantified using total hepatic RNA from control and inducer-treated wild-type and transcription factor-null mice on day 5. Data were normalized to glyceraldehyde 3-phosphate dehydrogenase (GAPDH) mRNA and are presented as mean relative expression ± S.E. For each graph, males are on the left and females are on the right. *, statistically significant difference (p < 0.05) compared with control mice of that genotype. †, statistically significant difference (p < 0.05) between wild-type and null control mice. ‡, statistically significant difference (p < 0.05) between wild-type and null inducer-treated mice.
Fig. 3.
Fig. 3.
Hepatic mRNA expression of Aldh family 3 to 9 enzymes in livers of wild-type and transcription factor-null mice after chemical activation. mRNA expression was quantified using total hepatic RNA from control and inducer-treated wild-type and transcription factor-null mice on day 5. Data were normalized to glyceraldehyde 3-phosphate dehydrogenase (GAPDH) mRNA and are presented as mean relative expression ± S.E. For each graph, males are on the left and females are on the right. *, statistically significant difference (p < 0.05) compared with control mice of that genotype. †, statistically significant difference (p < 0.05) between wild-type and null control mice. ‡, statistically significant difference (p < 0.05) between wild-type and null inducer-treated mice.
Fig. 4.
Fig. 4.
Hepatic mRNA expression of Ugt family 1 enzymes in livers of wild-type and transcription factor-null mice after chemical activation. mRNA expression was quantified using total hepatic RNA from control- and inducer-treated wild-type and transcription factor-null mice on day 5. Data were normalized to glyceraldehyde 3-phosphate dehydrogenase (GAPDH) mRNA and are presented as mean relative expression ± S.E. For each graph, males are on the left and females are on the right. *, statistically significant differences (p < 0.05) compared with control mice of that genotype. †, statistically significant difference (p < 0.05) between wild-type and null control mice. ‡, statistically significant difference (p < 0.05) between wild-type and null inducer-treated mice.
Fig. 5.
Fig. 5.
Hepatic mRNA expression of Ugt family 2 enzymes in livers of wild-type and transcription factor-null mice after chemical activation. mRNA expression was quantified using total hepatic RNA from control- and inducer-treated wild-type and transcription factor-null mice on day 5. Data were normalized to glyceraldehyde 3-phosphate dehydrogenase (GAPDH) mRNA and are presented as mean relative expression ± S.E. For each graph, males are on the left and females are on the right. *, statistically significant differences (p < 0.05) compared with control mice of that genotype. †, statistically significant difference (p < 0.05) between wild-type and null control mice. ‡, statistically significant difference (p < 0.05) between wild-type and null inducer-treated mice.
Fig. 6.
Fig. 6.
Hepatic mRNA expression of Sult and Papss2 enzymes in livers of wild-type and transcription factor-null mice after chemical activation. mRNA expression was quantified using total hepatic RNA from control- and inducer-treated wild-type and transcription factor-null mice on day 5. Data were normalized to glyceraldehyde 3-phosphate dehydrogenase (GAPDH) mRNA and are presented as mean relative expression ± S.E. For each graph, males are on the left and females are on the right. *, statistically significant differences (p < 0.05) compared with control mice of that genotype. †, statistically significant difference (p < 0.05) between wild-type and null control mice. ‡, statistically significant difference (p < 0.05) between wild-type and null inducer-treated mice.
Fig. 7.
Fig. 7.
Hepatic mRNA expression of Gst enzymes in livers of wild-type and transcription factor-null mice after chemical activation. mRNA expression was quantified using total hepatic RNA from control- and inducer-treated wild-type and transcription factor-null mice on day 5. Data were normalized to glyceraldehyde 3-phosphate dehydrogenase (GAPDH) mRNA and are presented as mean relative expression ± S.E. For each graph, males are on the left and females are on the right. *, statistically significant differences (p < 0.05) compared with control mice of that genotype. †, statistically significant difference (p < 0.05) between wild-type and null control mice. ‡, statistically significant difference (p < 0.05) between wild-type and null inducer-treated mice.
Fig. 8.
Fig. 8.
Hepatic mRNA expression of Gst enzymes in livers of wild-type and transcription factor-null mice after chemical activation. mRNA expression was quantified using total hepatic RNA from control- and inducer-treated wild-type and transcription factor-null mice on day 5. Data were normalized to glyceraldehyde 3-phosphate dehydrogenase (GAPDH) mRNA and are presented as mean relative expression ± S.E. For each graph, males are on the left and females are on the right. *, statistically significant differences (p < 0.05) compared with control mice of that genotype. †, statistically significant difference (p < 0.05) between wild-type and null control mice. ‡, statistically significant difference (p < 0.05) between wild-type and null inducer-treated mice.
Fig. 9.
Fig. 9.
Hepatic mRNA expression of uptake transporters in livers of wild-type and transcription factor-null mice after chemical activation. mRNA expression of Oatp and Mate transporters was quantified using total hepatic RNA from control- and inducer-treated wild-type and transcription factor-null mice on day 5. Data were normalized to glyceraldehyde 3-phosphate dehydrogenase (GAPDH) mRNA and are presented as mean relative expression ± S.E. For each graph, males are on the left and females are on the right. *, statistically significant differences (p < 0.05) compared with control mice of that genotype. †, statistically significant difference (p < 0.05) between wild-type and null control mice. ‡, statistically significant difference (p < 0.05) between wild-type and null inducer-treated mice.
Fig. 10.
Fig. 10.
Hepatic mRNA expression of efflux transporters in livers of wild-type and transcription factor-null mice after chemical activation. mRNA expression of Abc transporters, including the Mrp transporters, was quantified using total hepatic RNA from control- and inducer-treated wild-type and transcription factor-null mice on day 5. Data were normalized to glyceraldehyde 3-phosphate dehydrogenase (GAPDH) mRNA and are presented as mean relative expression ± S.E. For each graph, males are on the left and females are on the right. *, statistically significant differences (p < 0.05) compared with control mice of that genotype. †, statistically significant difference (p < 0.05) between wild-type and null control mice. ‡, statistically significant difference (p < 0.05) between wild-type and null inducer-treated mice.

References

    1. Akiyama TE, Nicol CJ, Fievet C, Staels B, Ward JM, Auwerx J, Lee SS, Gonzalez FJ, Peters JM. (2001) Peroxisome proliferator-activated receptor-α regulates lipid homeostasis, but is not associated with obesity: studies with congenic mouse lines. J Biol Chem 276:39088–39093 - PubMed
    1. Aleksunes LM, Manautou JE. (2007) Emerging role of Nrf2 in protecting against hepatic and gastrointestinal disease. Toxicol Pathol 35:459–473 - PubMed
    1. Aleksunes LM, Yeager RL, Klaassen CD. (2009) Application of multivariate statistical procedures to identify transcription factors that correlate with MRP2, 3, and 4 mRNA in adult human livers. Xenobiotica 39:514–522 - PMC - PubMed
    1. Alnouti Y, Klaassen CD. (2006) Tissue distribution and ontogeny of sulfotransferase enzymes in mice. Toxicol Sci 93:242–255 - PubMed
    1. Alnouti Y, Klaassen CD. (2008a) Regulation of sulfotransferase enzymes by prototypical microsomal enzyme inducers in mice. J Pharmacol Exp Ther 324:612–621 - PubMed

Publication types

MeSH terms

Substances