

Effects of K+-deficient diets with and without NaCl supplementation on Na+, K+, and H2O transporters' abundance along the nephron
- PMID: 22496411
- PMCID: PMC3431149
- DOI: 10.1152/ajprenal.00032.2012
Effects of K+-deficient diets with and without NaCl supplementation on Na+, K+, and H2O transporters' abundance along the nephron
Abstract
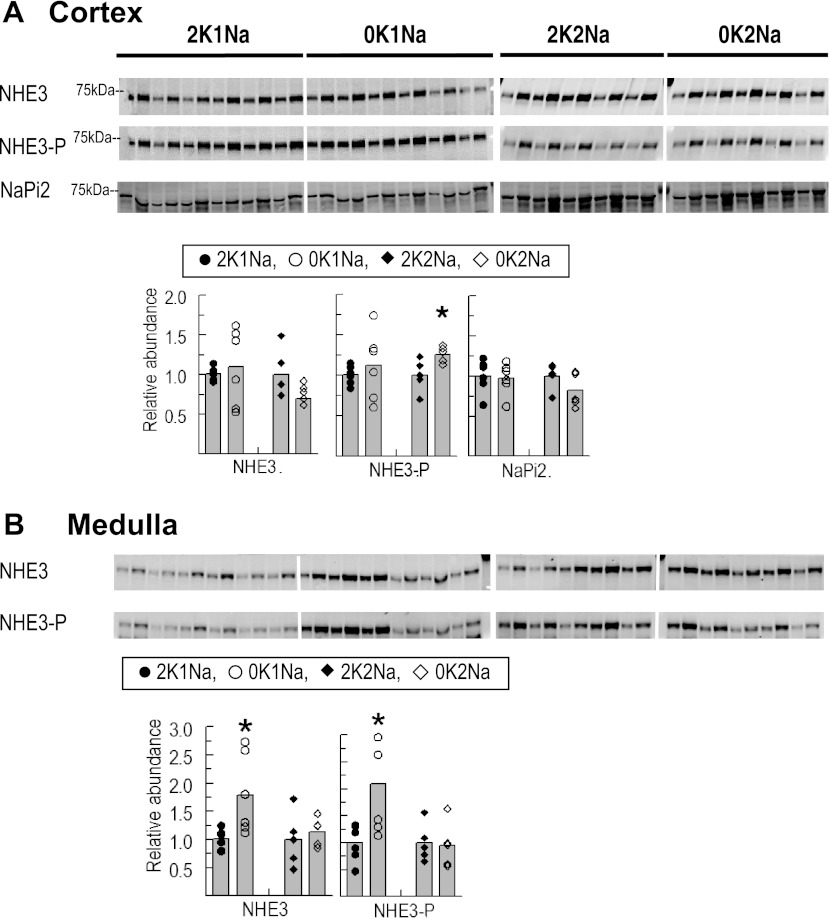
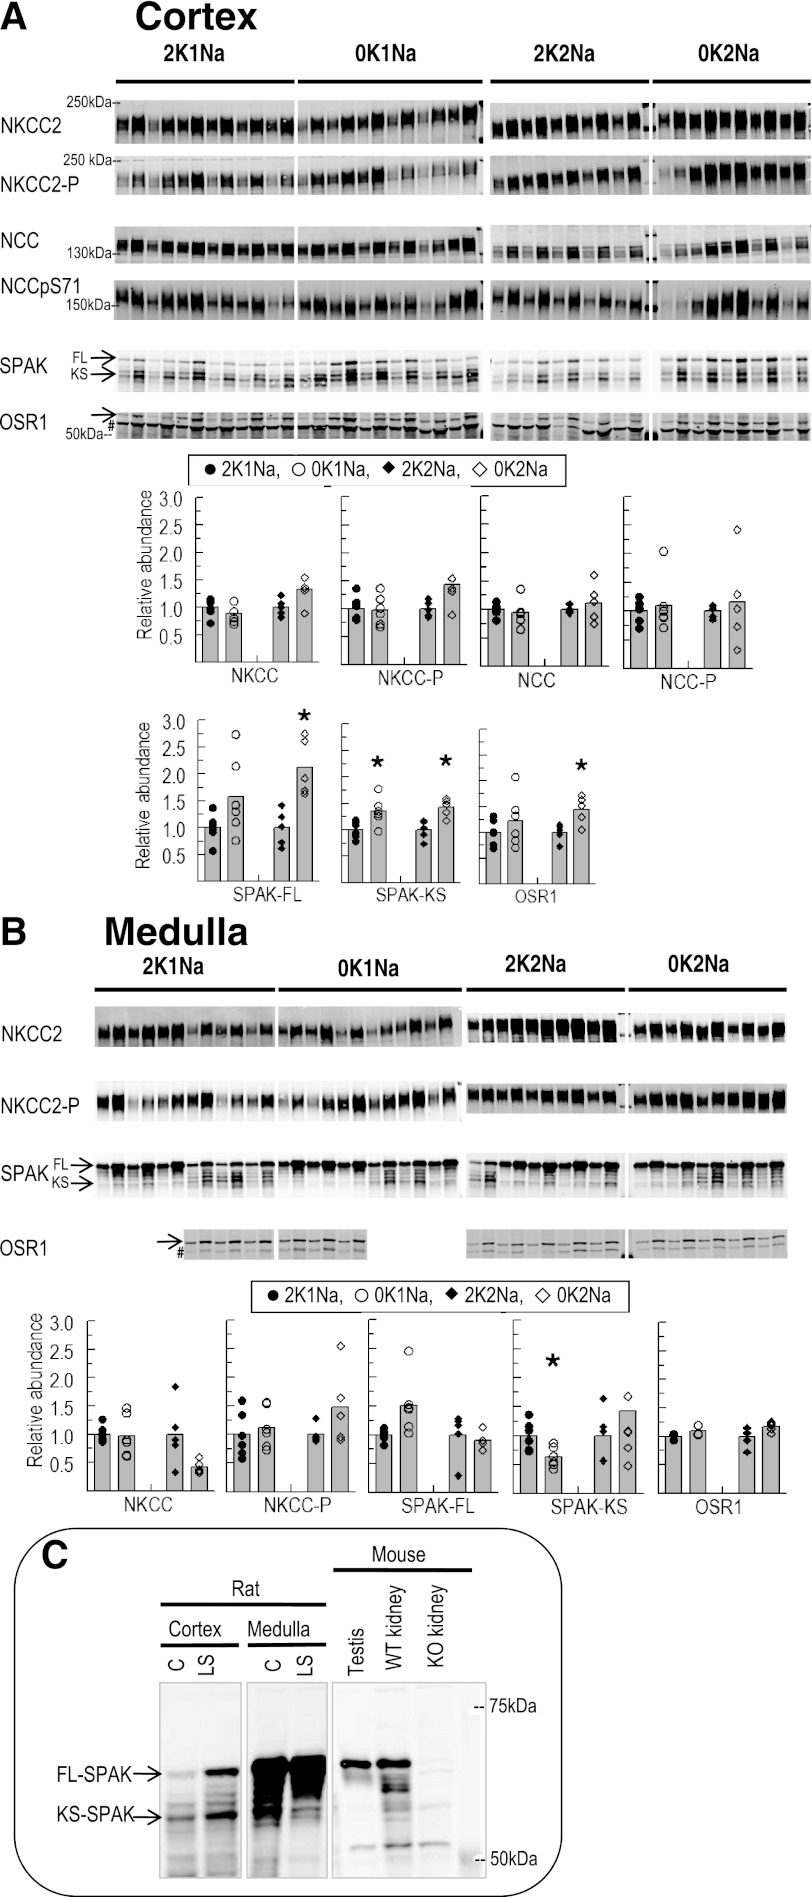
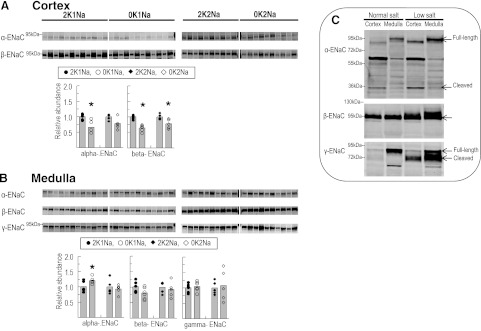
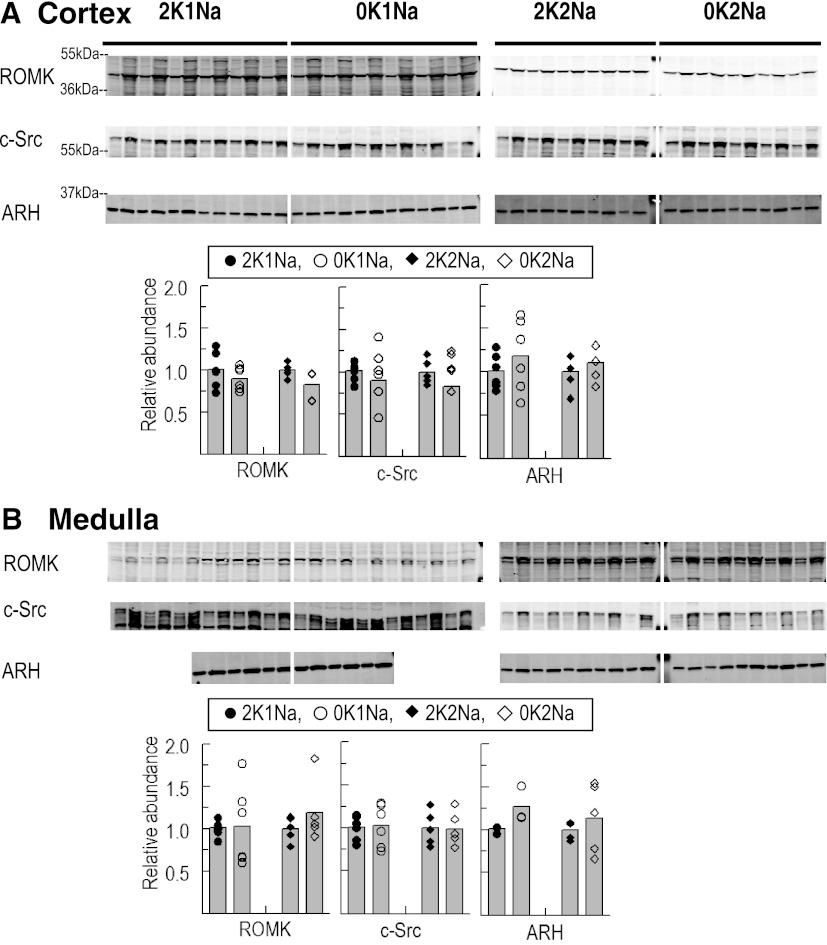
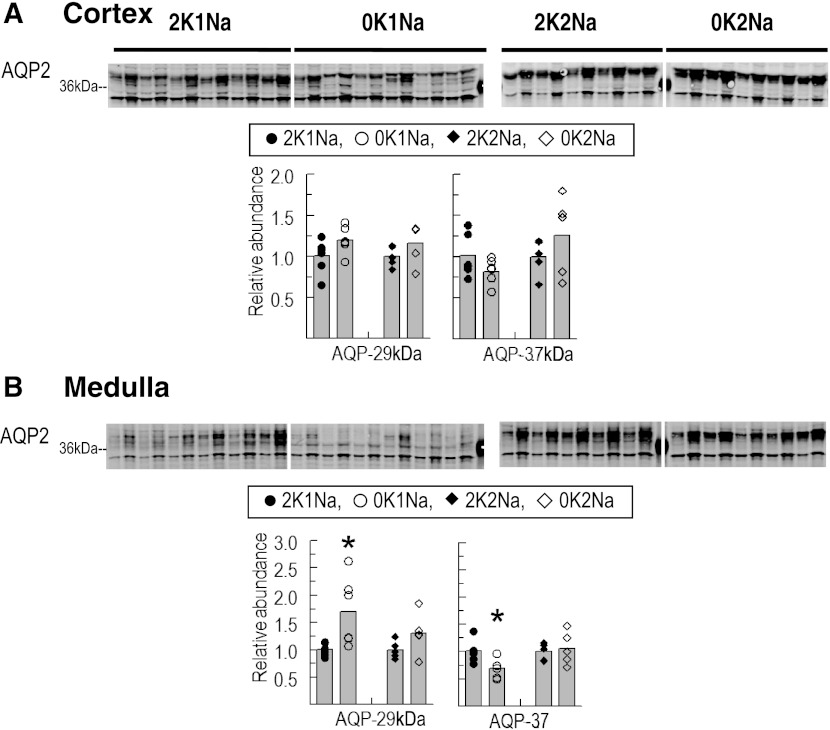
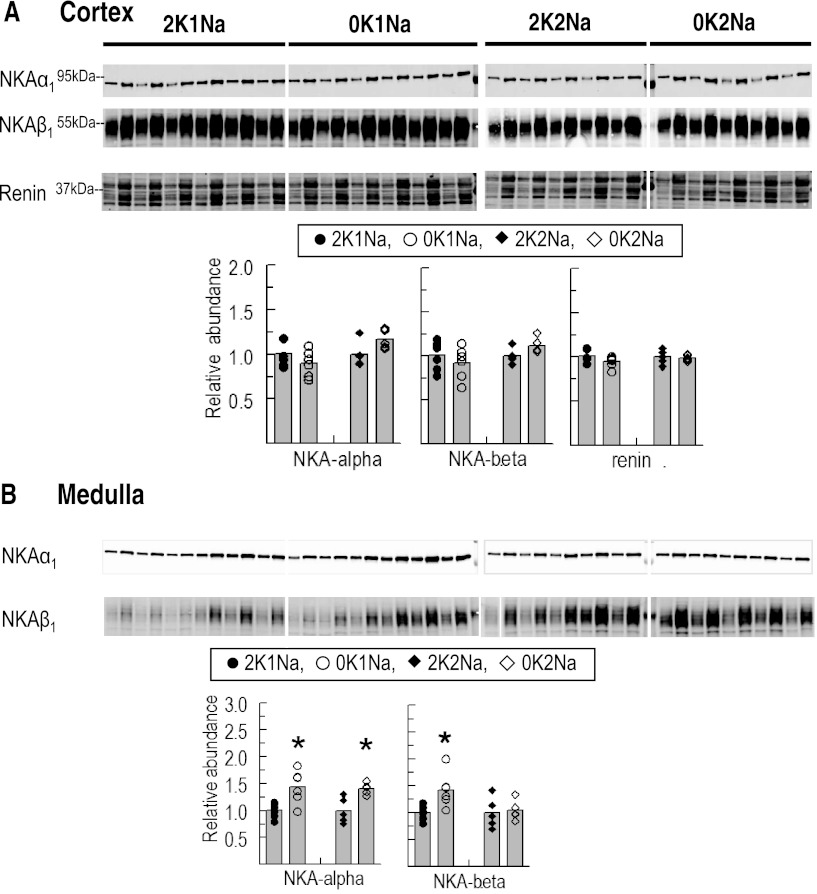
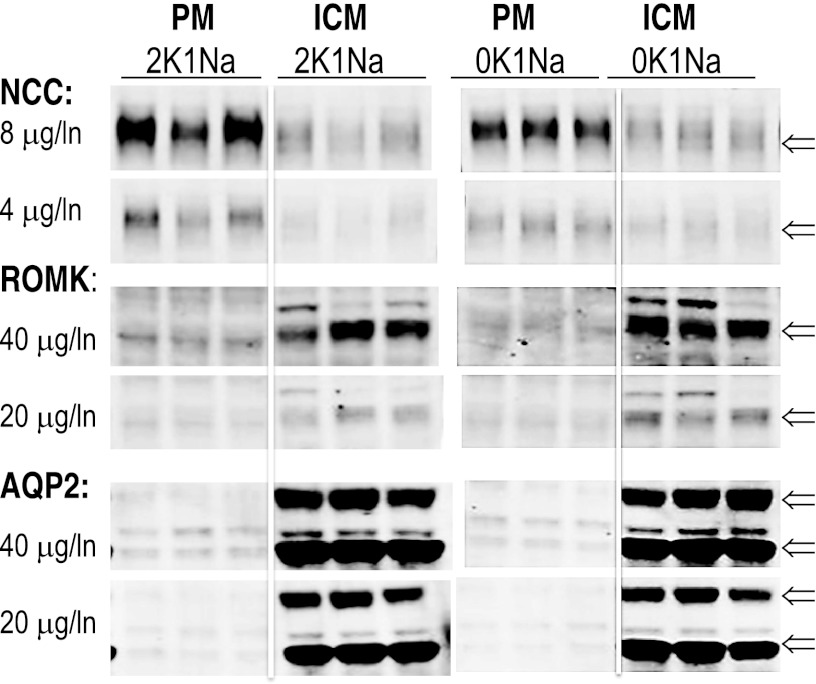
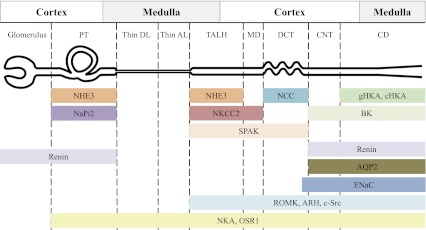
Dietary potassium (K(+)) restriction and hypokalemia have been reported to change the abundance of most renal Na(+) and K(+) transporters and aquaporin-2 isoform, but results have not been consistent. The aim of this study was to reexamine Na(+), K(+) and H(2)O transporters' pool size regulation in response to removing K(+) from a diet containing 0.74% NaCl, as well as from a diet containing 2% NaCl (as found in American diets) to blunt reducing total diet electrolytes. Sprague-Dawley rats (n = 5-6) were fed for 6 days with one of these diets: 2% KCl, 0.74% NaCl (2K1Na, control chow) compared with 0.03% KCl, 0.74% NaCl (0K1Na); or 2% KCl, 2%NaCl (2K2Na) compared with 0.03% KCl, 2% NaCl (0K2Na, Na(+) replete). In both 0K1Na and 0K2Na there were significant decreases in: 1) plasma [K(+)] (<2.5 mM); 2) urinary K(+) excretion (<5% of control); 3) urine osmolality and plasma [aldosterone], as well as 4) an increase in urine volume and medullary hypertrophy. The 0K2Na group had the lowest [aldosterone] (172.0 ± 17.4 pg/ml) and lower blood pressure (93.2 ± 4.9 vs. 112.0 ± 3.1 mmHg in 2K2Na). Transporter pool size regulation was determined by quantitative immunoblotting of renal cortex and medulla homogenates. The only differences measured in both 0K1Na and 0K2Na groups were a 20-30% decrease in cortical β-ENaC, 30-40% increases in kidney-specific Ste20/SPS1-related proline/alanine-rich kinase, and a 40% increase in medullary sodium pump abundance. The following proteins were not significantly changed in both the 0 K groups: Na(+)/H(+) exchanger isoform 3; Na(+)-K(+)-Cl(-) cotransporter; Na(+)-Cl(-) cotransporter, oxidative stress response kinase-1; renal outer medullary K(+) channel; autosomal recessive hypercholesterolemia; c-Src, aquaporin 2 isoform; or renin. Thus, despite profound hypokalemia and renal K(+) conservation, we did not confirm many of the changes that were previously reported. We predict that changes in transporter distribution and activity are likely more important for conserving K(+) than changes in total abundance.
Figures
Similar articles
-
Effects of dietary salt on renal Na+ transporter subcellular distribution, abundance, and phosphorylation status.Am J Physiol Renal Physiol. 2008 Oct;295(4):F1003-16. doi: 10.1152/ajprenal.90235.2008. Epub 2008 Jul 23. Am J Physiol Renal Physiol. 2008. PMID: 18653479 Free PMC article.
-
Time course of renal Na-K-ATPase, NHE3, NKCC2, NCC, and ENaC abundance changes with dietary NaCl restriction.Am J Physiol Renal Physiol. 2002 Oct;283(4):F648-57. doi: 10.1152/ajprenal.00016.2002. Am J Physiol Renal Physiol. 2002. PMID: 12217855
-
Potassium Supplementation Prevents Sodium Chloride Cotransporter Stimulation During Angiotensin II Hypertension.Hypertension. 2016 Oct;68(4):904-12. doi: 10.1161/HYPERTENSIONAHA.116.07389. Epub 2016 Sep 6. Hypertension. 2016. PMID: 27600183 Free PMC article.
-
Electroneutral absorption of NaCl by the aldosterone-sensitive distal nephron: implication for normal electrolytes homeostasis and blood pressure regulation.Cell Mol Life Sci. 2014 Aug;71(15):2879-95. doi: 10.1007/s00018-014-1585-4. Epub 2014 Feb 21. Cell Mol Life Sci. 2014. PMID: 24556999 Free PMC article. Review.
-
The renal response to potassium stress: integrating past with present.Curr Opin Nephrol Hypertens. 2017 Sep;26(5):411-418. doi: 10.1097/MNH.0000000000000352. Curr Opin Nephrol Hypertens. 2017. PMID: 28614118 Free PMC article. Review.
Cited by
-
Extracellular K+ rapidly controls NaCl cotransporter phosphorylation in the native distal convoluted tubule by Cl- -dependent and independent mechanisms.J Physiol. 2016 Nov 1;594(21):6319-6331. doi: 10.1113/JP272504. Epub 2016 Sep 11. J Physiol. 2016. PMID: 27457700 Free PMC article.
-
Dietary potassium and the renal control of salt balance and blood pressure.Pflugers Arch. 2015 Mar;467(3):513-30. doi: 10.1007/s00424-014-1673-1. Epub 2015 Jan 6. Pflugers Arch. 2015. PMID: 25559844 Review.
-
Paracellular epithelial sodium transport maximizes energy efficiency in the kidney.J Clin Invest. 2016 Jul 1;126(7):2509-18. doi: 10.1172/JCI83942. Epub 2016 May 23. J Clin Invest. 2016. PMID: 27214555 Free PMC article.
-
Differential regulation of Na+ transporters along nephron during ANG II-dependent hypertension: distal stimulation counteracted by proximal inhibition.Am J Physiol Renal Physiol. 2013 Aug 15;305(4):F510-9. doi: 10.1152/ajprenal.00183.2013. Epub 2013 May 29. Am J Physiol Renal Physiol. 2013. PMID: 23720346 Free PMC article.
-
Role of pituitary in K+ homeostasis: impaired renal responses to altered K+ intake in hypophysectomized rats.Am J Physiol Regul Integr Comp Physiol. 2013 Jun 15;304(12):R1166-74. doi: 10.1152/ajpregu.00495.2012. Epub 2013 Apr 17. Am J Physiol Regul Integr Comp Physiol. 2013. PMID: 23594607 Free PMC article.
References
-
- Abu Hossain S, Chaudhry FA, Zahedi KA, Siddiqui F, Amlal H. Cellular and molecular basis of increased ammoniagenesis in potassium deprivation. Am J Physiol Renal Physiol 301: (5) F969–F978, 2011 - PubMed
-
- Amlal H, Krane CM, Chen Q, Soleimani M. Early polyuria and urinary concentrating defect in potassium deprivation. Am J Physiol Renal Physiol 279: F655–F663, 2000 - PubMed
-
- Bostanjoglo M, Reeves WB, Reilly RF, Velazquez H, Robertson N, Litwack G, Morsing P, Dorup J, Bachmann S, Ellison DH. 11β-Hydroxysteroid dehydrogenase, mineralocorticoid receptor, and thiazide-sensitive Na-Cl cotransporter expression by distal tubules. J Am Soc Nephrol 9: 1347–1358, 1998 - PubMed
-
- Chiga M, Rai T, Yang SS, Ohta A, Takizawa T, Sasaki S, Uchida S. Dietary salt regulates the phosphorylation of OSR1/SPAK kinases and the sodium chloride cotransporter through aldosterone. Kidney Int 74: 1403–1409, 2008 - PubMed
-
- Clausen T. Hormonal and pharmacological modification of plasma potassium homeostasis. Fundam Clin Pharmacol 24: 595–605, 2010 - PubMed
Publication types
MeSH terms
Substances
Grants and funding
LinkOut - more resources
Full Text Sources
Medical
Miscellaneous