. 2012 Jul;23(14):2741-54.
doi: 10.1091/mbc.E11-04-0365. Epub 2012 Apr 11.

TFIIIC localizes budding yeast ETC sites to the nuclear periphery

Affiliations

TFIIIC localizes budding yeast ETC sites to the nuclear periphery

Shin-ichiro Hiraga et al. Mol Biol Cell. 2012 Jul.

Abstract

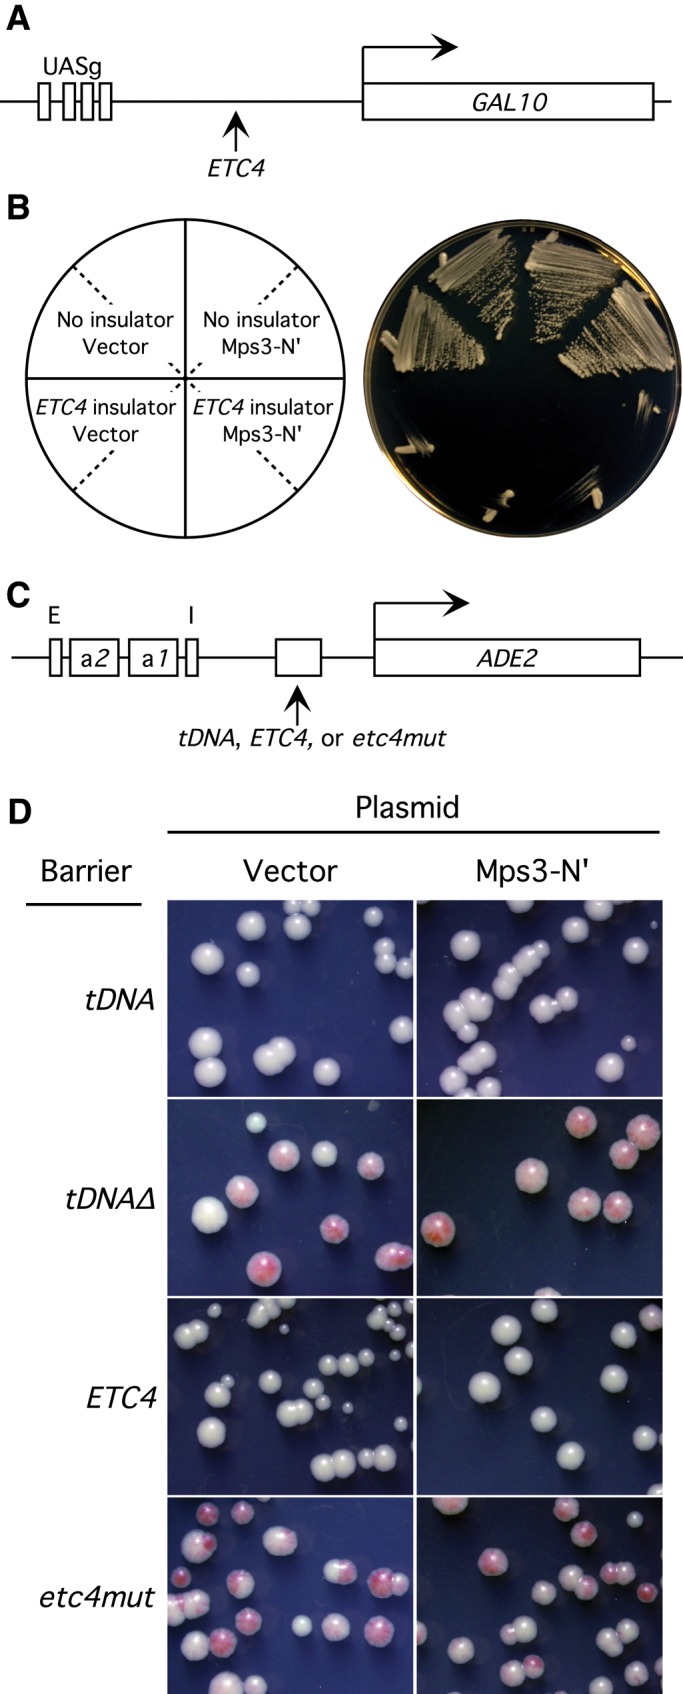
Chromatin function requires specific three-dimensional architectures of chromosomes. We investigated whether Saccharomyces cerevisiae extra TFIIIC (ETC) sites, which bind the TFIIIC transcription factor but do not recruit RNA polymerase III, show specific intranuclear positioning. We show that six of the eight known S. cerevisiae ETC sites localize predominantly at the nuclear periphery, and that ETC sites retain their tethering function when moved to a new chromosomal location. Several lines of evidence indicate that TFIIIC is central to the ETC peripheral localization mechanism. Mutating or deleting the TFIIIC-binding consensus ablated ETC -site peripheral positioning, and inducing degradation of the TFIIIC subunit Tfc3 led to rapid release of an ETC site from the nuclear periphery. We find, moreover, that anchoring one TFIIIC subunit at an ectopic chromosomal site causes recruitment of others and drives peripheral tethering. Localization of ETC sites at the nuclear periphery also requires Mps3, a Sad1-UNC-84-domain protein that spans the inner nuclear membrane. Surprisingly, we find that the chromatin barrier and insulator functions of an ETC site do not depend on correct peripheral localization. In summary, TFIIIC and Mps3 together direct the intranuclear positioning of a new class of S. cerevisiae genomic loci positioned at the nuclear periphery.


Figures

FIGURE 1:
FIGURE 1:
Chromosome dot assay reveals peripheral localization of ETC sites. (A) Illustration of strain construct used to test intranuclear positioning of ETC2, located within PPM2-ARG8 intergene on chromosome XV. The neighboring intergene (ARG8-CDC33) was GFP tagged by lacOp array insertion. The center of the lacOp array is 6.6 kb from the ETC2 locus. Chromosome dot strains to visualize other ETC sites were constructed similarly (see Table 1 in Materials and Methods). (B) Typical images of strains with chromosomal ETC2 tag, seen as a bright dot. The strain also expresses Nup49-GFP to visualize the nuclear membrane, seen as a dimmer ring. Right, DIC image . Scale bar, 3 μm. (C) Evaluation of ETC-site localization. Localization of the GFP dot was scored against three concentric zones with equal surface area as described in Materials and Methods. (D) ETC2 localization, assessed separately for cells in G1 phase, S phase, and G2 phase. Percentage of cells with ETC2 dot in each zone is plotted. (E) Percentage of cells showing peripheral (i.e., zone 1) positioning of ETC1-8 and a ChrVIint (control) site, plotted as the cumulative total of cells in G1, S, and G2 phases. Error bars represent SD of values obtained from independent strain isolates (n = 3, except ETC8, for which n = 2), for each of which at least 300 cells were inspected. Red dashed line represents the expected value (33.3%) for a randomly positioned locus. The p values were calculated by χ2 analysis in which actual distribution was compared with a hypothetical random distribution.
FIGURE 2:
FIGURE 2:
ETC7 does not colocalize with the nucleolus and telomeres. (A) Typical images of strains carrying GFP-tagged ETC7 and NOP1-mCherry, visualized as a green dot and a red crescent, respectively. Nup49-GFP reveals the nuclear rim. Sixty-eight percent of cells displayed no colocalization between ETC7 and the nucleolus (i, left); in only 32% of cells was the ETC7 signal immediately juxtaposed to or within the nucleolus (ii, right). White arrowheads mark the ETC7 GFP dot. Scale bar, 3 μm. Scores represent the average from three independent strain isolates (SBY31, SBY32, and SBY33), for each of which at least 180 cells were inspected. (B) Typical Z-stack series of images showing strains carrying GFP-tagged ETC7 and RAP1-mCherry. Nup49-GFP reveals the nuclear rim. Shown for Z-stack series (i) and (ii) are (top) mCherry signal (telomere foci), (middle) GFP (ETC7 and nuclear rim), and (bottom) merged overlay. White arrowheads mark telomere foci. Scale bar, 3 μm. The majority of cells (89%) showed no coincidence of ETC7 with telomeric foci, as series (i); in only 11% of cells was ETC7 observed to associate with telomere clusters, as series (ii). Scores represent the average from three independent strain isolates (SBY84, SBY85, and SBY86), for each of which at least 210 cells were inspected.
FIGURE 3:
FIGURE 3:
The extended B box consensus is crucial for peripheral localization of ETC6. (A) Sequence comparisons show the TFIIIC-binding B box consensus present at tRNA genes, the extended B box–related consensus sequence of ETC sites, a 55–base pair stretch of the TFC6-ESC2 intergene containing ETC6, and the sequence of the etc6Δ strain. (B) The ETC6 consensus is required for TFIIIC binding. Binding of FLAG-tagged Tfc1 protein to ETC6 or the etc6Δ locus was examined by chromatin immunoprecipitation. Strains are DDY4729 and DDY4732. (C) Intranuclear positioning of the etc6Δ locus, plotted as in Figure 1D. (D) Intranuclear positioning of ETC6. Dashed black lines indicate the value expected for random localization in these and subsequent graphs. Strains are SBY1, SBY2, and SBY6 (ETC6) and SBY37 and SBY38 (etc6Δ). Error bars represent SD of values obtained from independent strain isolates (n = 3 for ETC6, n = 2 for etc6Δ). The p values were calculated by χ2 analysis in which the observed distribution for etc6Δ was compared with either a hypothetical random distribution or to ETC6. At least 150 cells were inspected at each cell cycle stage for each strain.
FIGURE 4:
FIGURE 4:
An ETC site inserted at a randomly positioned locus directs peripheral localization. (A) Illustration of strain construct. Intergene YNL179C-RPS3, at 302 kb on the chromosome XIV left arm, was GFP tagged using a lacOp array. A 91–base pair fragment of either wild-type ETC4 or a version of ETC4 with a single base substitution in its B box consensus (etc4mut) was inserted as illustrated, and localization was tested. (The total insertion length in both cases was 225 base pairs, with the 91–base pair ETC4 or etc4mut sequences flanked by 23– and 111–base pair sequences derived from plasmid vector at left and right, respectively.) (B) Intranuclear positioning of GFP-tagged ChrXIV-302 locus, plotted as in Figure 1D. (C) Intranuclear positioning of the ChrXIV-302 locus with inserted ETC4. (D) Intranuclear positioning of the ChrXIV-302 locus with etc4mut insertion. Error bars represent SD of values obtained from three independent strain isolates. The p values were calculated by χ2 analysis, with observed positioning compared either to ChrXIV-302 or to a hypothetical random distribution. For the etc4mut construction, p values against the inserted ETC4 were also calculated. Strains were SBY76, SBY77, SBY78 (ChrXIV-302), SHY465 (ChrXIV-302 + ETC4), and SHY468 (ChrXIV-302 + etc4mut). At least 80 cells were inspected at each cell cycle stage for each strain.
FIGURE 5:
FIGURE 5:
TFIIIC plays a critical role in peripheral anchoring of ETC sites. (A) Subnuclear positioning of ETC4 was examined in a strain SHY476 expressing Tfc3 C-terminally tagged with an auxin-inducible degron. Degradation of Tfc3 protein was induced by adding 3-indoleacetic acid, and perinuclear positioning of ETC4 was examined 1 h later. (B) Subnuclear positioning of ETC4 was examined in control strain SHY472 that lacks the degron. The p values were calculated by χ2 analysis in which observed distribution was compared either to a hypothetical random distribution or to that for control strain. At least 50 cells were inspected for each cell cycle stage in each strain.
FIGURE 6:
FIGURE 6:
TFIIIC subunits can mediate peripheral anchoring. (A) Illustration of ChrVIint locus in tethering assay strain. In addition to lacOp repeats, an array of four lexAOp-binding sites is inserted at 199.2 kb on the chromosome VI right arm, adjacent to replication origin ARS607 (Taddei et al., 2004). (B) Positioning of ChrVIint induced by LexA-Tfc1, tested as in Figure 1D. (C) Positioning of ChrVIint induced by LexA-Tfc6. (D) Positioning of ChrVIint when LexA is expressed. Strains were GA1461 (LexA); SBY155, SBY156 (LexA-Tfc1); and SBY144 and SBY146 (LexA-Tfc6). Error bars represent SD of values obtained from independent strain isolates (n = 2). The p values were calculated by χ2 analysis in which observed distribution was compared either to a hypothetical random distribution or to distribution on expression of LexA. At least 130 cells were inspected for each strain at each cell cycle stage. (E) LexA-Tfc3 and LexA-Tfc6 subunit fusions recruit Tfc1 to ectopic lexAOp-binding sites. Binding of FLAG-tagged Tfc1 protein close to lexAOp sites was examined by chromatin immunoprecipitation in strains expressing LexA or the fusion protein LexA-Tfc3 or LexA-Tfc6. The anti-FLAG chromatin immunoprecipitates show enrichment for sequences surrounding the lexAOp sites when LexA-Tfc3 or LexA-Tfc6 is expressed but not when LexA alone is expressed. Amplification of an unrelated tRNA gene sequence (tDNA) shown as a Tfc1-binding control locus. Strains are SHY459, SHY461, and SHY463.
FIGURE 7:
FIGURE 7:
An Mps3 N-terminal domain plays a role in peripheral anchoring of ETC sites. (A) Subnuclear positioning of ETC6 in mps3Δ75-150 strain was tested as in Figure 1D. Strain is SBY191. ETC6 positioning in wild type is shown in Figure 3. (B) Subnuclear positioning of ETC2 in mps3Δ75-150 strain. Strain is SBY195. ETC2 positioning in wild type is shown in Figure 1. (C) Subnuclear localization of ETC4 in strain expressing Mps3-N′-tetR-mCherry (Mps3-N′) from a multicopy vector. (D) Normal subnuclear localization pattern of ETC4, shown for reference. Strains used were SBY196 (ETC6; mps3Δ75-150); SBY194, SBY197, and SBY198 (ETC2; mps3Δ75-150); SBY217 and SBY218 (Mps3-N′); and SBY21, SBY22, and SBY23 (wild type). Error bars represent SD of values obtained from independent strain isolates (n = 3 for data presented in A, B, and D; n = 2 for C). The p values were calculated by χ2 analysis in which observed distribution was compared either to a hypothetical random distribution or to that for normal ETC localization. At least 160 cells were inspected at each cell cycle stage for each strain.
FIGURE 8:
FIGURE 8:
Mps3-N′ expression antagonizes peripheral anchoring by TFIIIC subunits. Tethering of ChrVIint in strains expressing LexA-Tfc7, LexA-Tfc1, and LexA-Yif1 (white, gray, and black bars respectively) compared with the same strains expressing Mps3-N′ from a multicopy vector (striped white, striped gray, and striped black bars respectively). Percentages of interphase cells showing peripheral (zone 1) positioning of ChrVIint are plotted (i.e., cumulative total of G1-, S-, and G2-phase cells). Strains used were SBY148, SBY149 (LexA-Tfc7); SBY155, SBY156 (LexA-Tfc1); SBY211, SBY212 (LexA-Yif1); SBY219, SBY220 (LexA-Tfc7 + Mps3-N′); SBY221, SBY222 (LexA-Tfc1 + Mps3-Nz); and SBY223 and SBY224 (LexA-Yif1 + Mps3-Nz). Error bars represent SD of values obtained from independent strain isolates (n = 2). The p values were calculated by χ2 analysis in which observed distribution was compared either to a hypothetical random distribution or to distribution in the absence of Mps3-N′.
FIGURE 9:
FIGURE 9:
ETC4 transcriptional insulator and barrier activities are not affected by expressing the dominant-negative Mps3-N′ construct that inhibits Mps3-mediated localization. (A) Cartoon of test construct. ETC4 inserted between the GAL10 gene and its upstream UASG control sequences acts as an insulator and prevents transcriptional activation. (B) ETC4 insulator activity prevents growth on galactose medium (bottom left quadrant), and expression of Mps3-N′ does not relieve this effect (bottom right quadrant). Strains are DDY3 and DDY3770, transformed with plasmids pRS426 (vector) or pSB79 (Mps3-N′). (C) HMR-based chromatin barrier test construct. Spreading of heterochromatin from HMR causes transcriptional repression of reporter gene ADE2. The neighboring tDNA provides barrier activity to prevent the spread of silent chromatin; deleting this tDNA results in heterochromatin spreading, causing pink colonies. Barrier activity is retained if the tDNA is substituted by ETC4 (but not a mutated version, etc4mut) (D) Expressing dominant-negative Mps3-N′ does not interfere with chromatin barrier function of ETC4. Colony color assays of strains with tDNA, tdnaΔ, ETC4, or etc4mut, containing either empty vector (left) or the Mps3‑N′ plasmid pSB79 (right). Chromatin barrier activity allows ADE2 expression and white colony color, whereas strains lacking barrier function exhibit pink or red colony color. Strains are DDY811, DDY814, DDY3743, and DDY3812, transformed with plasmid pRS426 (vector) or pSB79 (Mps3-N′).

Similar articles

Cited by

References

    1. Albert I, Mavrich TN, Tomsho LP, Qi J, Zanton SJ, Schuster SC, Pugh BF. Translational and rotational settings of H2A.Z nucleosomes across the Saccharomyces cerevisiae genome. Nature. 2007;446:572–576. - PubMed
    1. Andrulis ED, Neiman AM, Zappulla DC, Sternglanz R. Perinuclear localization of chromatin facilitates transcriptional silencing. Nature. 1998;394:592–595. - PubMed
    1. Baker RE, Gabrielsen O, Hall BD. Effects of tRNATyr point mutations on the binding of yeast RNA polymerase III transcription factor C. J Biol Chem. 1986;261:5275–5282. - PubMed
    1. Bartholomew B, Kassavetis GA, Braun BR, Geiduschek EP. The subunit structure of Saccharomyces cerevisiae transcription factor IIIC probed with a novel photocrosslinking reagent. EMBO J. 1990;9:2197–2205. - PMC - PubMed
    1. Belgareh N, Doye V. Dynamics of nuclear pore distribution in nucleoporin mutant yeast cells. J Cell Biol. 1997;136:747–759. - PMC - PubMed

Publication types

MeSH terms