. 2012 Jun;23(11):2198-212.
doi: 10.1091/mbc.E11-11-0936. Epub 2012 Apr 11.

Phosphatidylserine dynamics in cellular membranes

Affiliations

Phosphatidylserine dynamics in cellular membranes

Jason G Kay et al. Mol Biol Cell. 2012 Jun.

Abstract

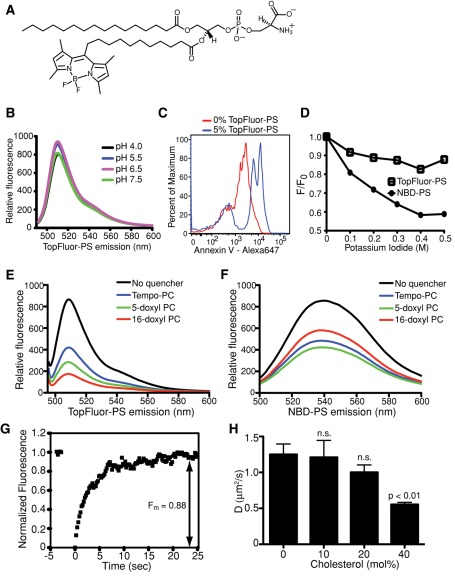
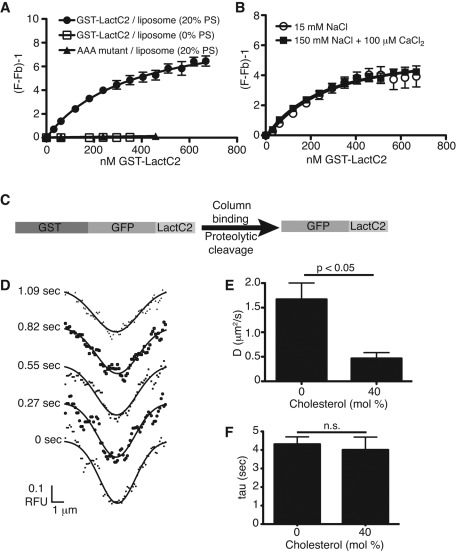
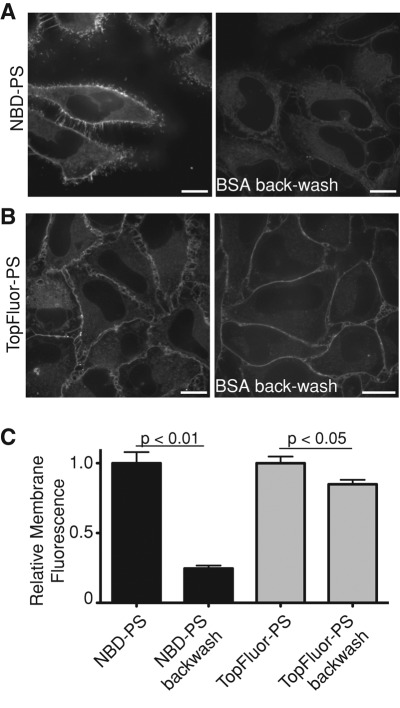
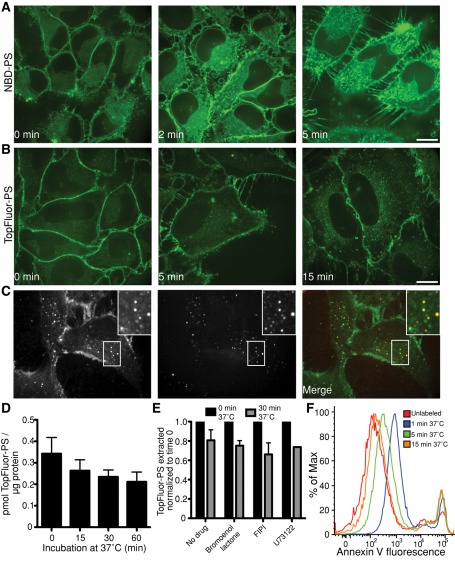
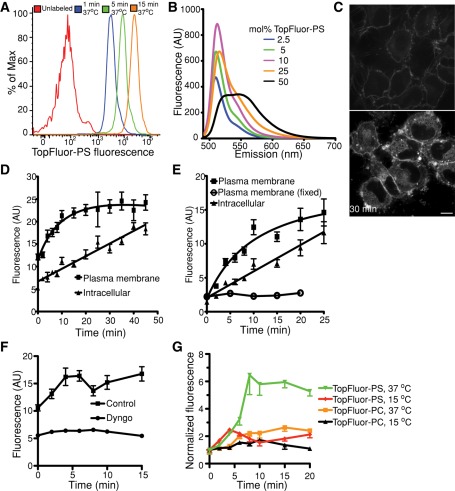
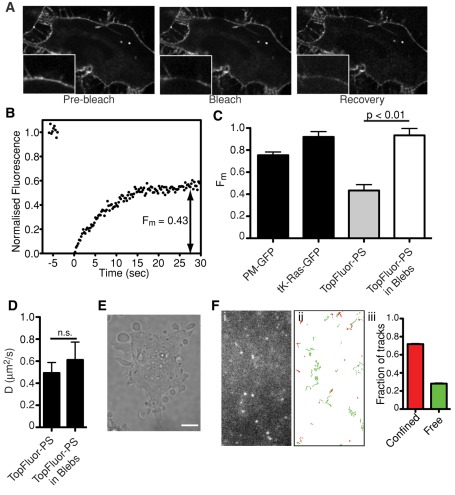
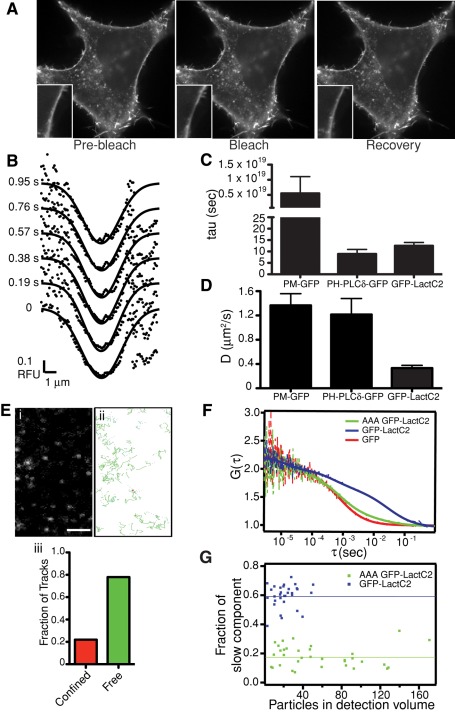
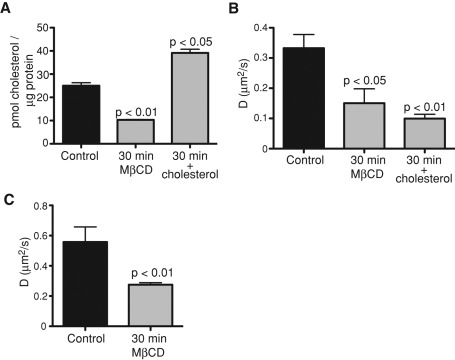
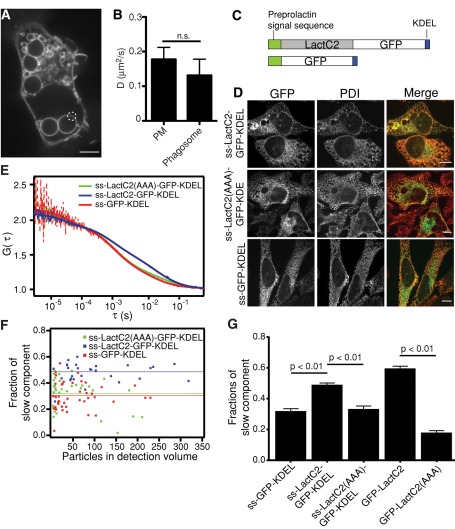
Much has been learned about the role of exofacial phosphatidylserine (PS) in apoptosis and blood clotting using annexin V. However, because annexins are impermeant and unable to bind PS at low calcium concentration, they are unsuitable for intracellular use. Thus little is known about the topology and dynamics of PS in the endomembranes of normal cells. We used two new probes-green fluorescent protein (GFP)-LactC2, a genetically encoded fluorescent PS biosensor, and 1-palmitoyl-2-(dipyrrometheneboron difluoride)undecanoyl-sn-glycero-3-phospho-L-serine (TopFluor-PS), a synthetic fluorescent PS analogue-to examine PS distribution and dynamics inside live cells. The mobility of PS was assessed by a combination of advanced optical methods, including single-particle tracking and fluorescence correlation spectroscopy. Our results reveal the existence of a sizable fraction of PS with limited mobility, with cortical actin contributing to the confinement of PS in the plasma membrane. We were also able to measure the dynamics of PS in endomembrane organelles. By targeting GFP-LactC2 to the secretory pathway, we detected the presence of PS in the luminal leaflet of the endoplasmic reticulum. Our data provide new insights into properties of PS inside cells and suggest mechanisms to account for the subcellular distribution and function of this phospholipid.


Figures

FIGURE 1:
FIGURE 1:
Spectral properties and dynamics of TopFluor-PS in lipid bilayers. (A) The structure of TopFluor-PS. The fluorescent moiety is at the end of an 11-carbon acyl chain on sn-2 of the glycerophospholipid analogue. (B) Emission spectra of liposomes containing 95% DOPC and 5% TopFluor-PS excited at 470 nm. The emission peaks at 510 nm and is minimally affected by changes in pH. (C) FACS analysis of annexin V–Alexa 647 binding to 3-μm Nucleosil C18 beads coated with 100% DOPC (0% TopFluor-PS; red) or 95% DOPC, 5% TopFluor-PS (blue). (D) Quenching of the fluorescence of liposomes containing 95% DOPC and either 5% NBD-PS or 5% TopFluor-PS by varying concentrations of iodide. Data are plotted according to the Stern–Volmer relationship, where F0 is the initial fluorescence and F is the fluorescence in the presence of the quenching agent. (E, F) Emission profiles of liposomes containing TopFluor-PS (E) or NBD-PS (F) and the indicated fluorescence-quenching spin-labeled lipids (5% fluorescent lipid, 10% spin-labeled lipid, and 85% DOPC). (G) Representative FRAP recovery curve of TopFluor-PS in a supported lipid bilayer. Average Fm of all supported bilayers tested (n = 36) was 0.88 ± 0.05. (H) Diffusion coefficients calculated by FRAP analysis of TopFluor-PS in supported lipid bilayers containing varying concentrations of cholesterol. Data are means ± SEM of 9–31 independent determinations from three experiments. n.s., not significantly different from 0% cholesterol.
FIGURE 2:
FIGURE 2:
PS-binding properties and bilayer dynamics of recombinant LactC2. (A) Binding isotherms of recombinant GST-LactC2 or GST-LactC2(AAA) to egg-PC/dansyl-PE (2.5 mol %) liposomes with or without 20% PS in 150 mM NaCl-containing buffer. The term (F/Fb) − 1 (y-axis) refers to the observed FRET fluorescence resulting from the close proximity of dansyl-PE in the liposome and tryptophan residues in GST-LactC2. The traces are nonlinear least-squares curves fit to a one-site binding hyperbola (Gilbert et al., 1990), yielding Kd for LactC2 PS binding of 351 ± 72 nM. (B) Effects of calcium and of changes in ionic strength on LactC2 binding to PS-containing liposomes. Ionic strength was reduced by lowering NaCl concentration to 15 mM. Where indicated, 100 μM CaCl2 was added. (C) Diagram of strategy for purification of GFP-LactC2. GST-GFP-LactC2 construct in pGEX-6p was expressed in E. coli, lysates were bound to glutathione–Sepharose, and GFP-LactC2 was cleaved on-column from GST with PreScission protease. (D) Sample Gaussian best fits of fluorescence intensity profiles obtained during FRAP of purified GFP-LactC2 bound to a supported lipid bilayer containing 15% DOPS (see Hammond et al., 2009, for details). (E, F) Diffusion coefficients (E) and τ (F) calculated for GFP-LactC2 association with supported lipid bilayers containing 15% DOPS and varying mol % cholesterol. Data are means ± SEM of 7–13 independent determinations from two experiments.
FIGURE 3:
FIGURE 3:
TopFluor-PS is poorly extracted from cellular membranes. (A, B) Cells were loaded for 10 min at 4°C with either NBD-PS (A) or TopFluor-PS (B) and images acquired by confocal microscopy before or immediately after backwashing with 1% BSA for 10 min; identical acquisition settings were maintained throughout for each fluorophore. Scale bars, 10 μm. (C) Quantification of membrane-associated fluorescence before and after BSA backwashing. Data are means ± SEM of three experiments.
FIGURE 4:
FIGURE 4:
Distribution and stability of fluorescent PS analogues in cells. (A, B) HeLa cells were loaded for 10 min at 4°C with either NBD-PS (A) or TopFluor-PS (B), transferred to a microscope with a heated stage, and confocal images acquired at the indicated times of incubation at 37°C. (C) Colocalization of intracellular TopFluor-PS with internalized dextran. After loading with TopFluor-PS to cells at 4°C, cells were transferred to medium at 37°C containing the fluid-phase marker rhodamine-dextran for 10 min, followed by imaging. All bars, 10 μm. (D) After loading with TopFluor-PS for 30 min at 4°C, cells were incubated at 37°C for the indicated times; total lipids were then extracted and analyzed by TLC. The amount of intact TopFluor-PS extracted from cells is shown. Data are means ± SEM of seven independent experiments. (E) After loading with TopFluor-PS as in D, cells were incubated at 37°C for 30 min in the presence or absence of the indicated phospholipase inhibitors, and the amount of TopFluor-PS extracted from cells was normalized to the amount extracted without incubation at 37°C. (F) RAW cells were loaded with TopFluor-PS as in D and then allowed to recover at 37°C for the indicated time before staining with annexin V–Alexa 647. Annexin V staining was determined by flow cytometry after gating for live cells.
FIGURE 5:
FIGURE 5:
TopFluor-PS self-quenches in the plasmalemma. (A) TopFluor-PS self-quenches when added to cells at high concentrations and dequenches upon redistribution. TopFluor-PS fluorescence detected by flow cytometry in cells loaded for 30 min at 4°C with 10 nmol of TopFluor-PS complexed to BSA per ml of PBS, followed by extensive washing and incubation at 37°C for the indicated times. The emission (scattering) from unlabeled cells is shown for reference. (B) Fluorescence emission spectra of liposomes containing increasing concentrations of TopFluor-PS (in mol %). (C) HeLa cells were loaded as in A (left, 0 min), followed by warming to 37°C for 30 min (right). Scale bar,10 μm. (D, E) HeLa (D) or RAW (E) cells were loaded at 4°C with TopFluor-PS and then warmed for the indicated times. Fluorescence intensity at the plasma membrane and inside the cells was quantified. Where indicated, the cells were fixed with paraformaldehyde before loading. Data are means ± SEM of four independent experiments. (F) Cells were loaded at 4°C with TopFluor-PS and treated with or without 20 μM Dyngo-4a. Fluorescence intensity at the plasma membrane was quantified over time. (G) HeLa cells were loaded with TopFluor-PS or TopFluor-PC at 4°C; the plasmalemmal fluorescence intensity was quantified during subsequent incubation at either 37 or 15°C.
FIGURE 6:
FIGURE 6:
Movement of TopFluor-PS in the plasma membrane. (A) The mobility of TopFluor-PS was analyzed by FRAP in HeLa cells at 37°C. Representative images are shown, with magnifications of the indicated area shown in insets. Scale bar, 10 μm. (B) Sample FRAP recovery curve of TopFluor-PS obtained as in A. The average Fm of TopFluor-PS obtained from 13 independent determinations was 0.43 ± 0.06. (C, D) Fm and D of various fluorophores in the intact plasma membrane and in membrane blebs. HeLa cells were transfected with PM-GFP or tK-Ras-GFP or loaded with TopFluor-PS. Where indicated, blebs were induced using jasplakinolide. Fm and D were measured using FRAP. Data are means ± SEM of at least 10 independent determinations from two experiments. (E) Induction of membrane blebs by jasplakinolide. HeLa cells were treated with 1 μM jasplakinolide for 10 min and imaged by differential interference contrast. Size bar, 10 μm. (F) Representative image (i) and tracks (ii) of single TopFluor-PS particles in the ventral membrane of HeLa cells detected by TIRFM using an electron-multiplied charge-coupled device camera. Tracks are color coded: particles displaying free Brownian diffusion are green, and those classified as confined are red. Graph in (iii) shows classification breakdown obtained for 1237 single-particle tracks like those in (i). Scale bar, 2 μm.
FIGURE 7:
FIGURE 7:
Movement of PS-associated GFP-LactC2 in the plasma membrane. (A) The mobility of PS-associated GFP-LactC2 was analyzed by FRAP in HeLa cells at 37°C. Representative images are shown, with magnifications of the indicated area shown in insets. Scale bar, 10 μm. (B) Sample Gaussian best fits of fluorescence intensity profiles obtained during FRAP of GFP-LactC2 in HeLa cells. (C, D) HeLa cells were transfected with PM-GFP, PLCδ-GFP, or GFP-LactC2 and subjected to FRAP, followed by analysis as described in Hammond et al. (2009). Average values of τ and D are shown in C and D, respectively. Data are means ± SEM of 18–39 independent determinations. (E) Representative image (i) and tracks (ii) of single PS-associated GFP-LactC2 particles in the ventral membrane of HeLa cells detected by TIRFM. Scale bar, 2 μm. Graph in (iii) shows classification breakdown obtained for 29,007 single-particle tracks like those in (i). (F) Normalized FCS curves representing the following constructs: red, GFP; blue, GFP-LactC2; green, GFP-LactC2(AAA). See Supplementary Methods for a description of the autocorrelation function (G(τ)). Dashed lines are measured, whereas the full lines are fitted curves. (G) Fraction of slow components as measured by FCS for GFP-LactC2 (blue) and GFP-LactC2(AAA) (green). The lines indicate the mean value of the fraction.
FIGURE 8:
FIGURE 8:
Cholesterol influences PS movement in the plasma membrane. (A) Verification of cholesterol depletion and enrichment. HeLa cells were either left untreated (control) or were exposed for 30 min to 10 mM MβCD in the absence or presence of excess (50 μg/ml) cholesterol. The cholesterol content of the cells was then measured using cholesterol oxidase-Amplex Red, as described in Materials and Methods. Data are means ± SEM of four independent experiments. (B) Diffusion coefficients of PS in HeLa cells before and after cholesterol depletion or enrichment as obtained by FRAP analysis of GFP-LactC2 (C) Diffusion coefficients of TopFluor-PS in HeLa cells before and after cholesterol depletion accomplished by 30-min incubation with 10 mM MβCD. Data are means ± SEM of 21–40 independent determinations.
FIGURE 9:
FIGURE 9:
Measurements of PS in intracellular membranes. (A, B) Measurement of the diffusion coefficient of PS in phagosomes by FRAP analysis of GFP-LactC2. (A) Example of phagosomes used to perform FRAP analysis in RAW macrophages. Photobleached area is encircled. Scale bar, 5 μm. (B) Comparison of diffusion coefficients calculated for the plasma membrane and phagosomal membrane. Data are means ± SEM of 19–32 independent determinations. (C) Schematic structures for the constructs used for detection of fluorescence in the ER: ss-LactC2-GFP-KDEL and ss-GFP-KDEL. (D) Spinning-disk confocal images of HeLa cells transfected with ss-LactC2-GFP-KDEL, ss-LactC2(AAA)-GFP-KDEL, or ss-GFP-KDEL and immunostained for protein disulfide isomerase (PDI). Scale bars, 10 μm. (E) Normalized FCS curves for the following constructs: red, ss-GFP-KDEL; blue, ss-LactC2-GFP-KDEL; green, ss-LactC2(AAA)-GFP-KDEL. Dashed lines are measured, whereas the solid lines are fitted curves. (F) Fraction of slow components measured by FCS in each cell for different proteins. The lines indicate the mean value of the fraction. (G) Comparison of the fraction of total molecules assigned to the slow component for the different constructs, calculated by FCS. Data are means ± SEM of 29–41 independent determinations.

References

    1. Abrams FS, London E. Extension of the parallax analysis of membrane penetration depth to the polar region of model membranes: use of fluorescence quenching by a spin-label attached to the phospholipid polar headgroup. Biochemistry. 1993;32:10826–10831. - PubMed
    1. Andersen MH, Graversen H, Fedosov SN, Petersen TE, Rasmussen JT. Functional analyses of two cellular binding domains of bovine lactadherin. Biochemistry. 2000;39:6200–6206. - PubMed
    1. Arikketh D, Nelson R, Vance JE. Mobility measurement by analysis of fluorescence photobleaching recovery kinetics. Biophys J. 2008;16:1055–1069. - PMC - PubMed
    1. Bai J, Pagano RE. Measurement of spontaneous transfer and transbilayer movement of BODIPY-labeled lipids in lipid vesicles. Biochemistry. 1997;36:8840–8848. - PubMed
    1. Bates IR, Hébert B, Luo Y, Liao J, Bachir AI, Kolin DL, Wiseman PW, Hanrahan JW. Mass spectrometric analysis reveals an increase in plasma membrane polyunsaturated phospholipid species upon cellular cholesterol loading. Biochemistry. 2001;40:14635–14644. - PubMed

Publication types

MeSH terms

LinkOut - more resources