. 2012 Jul;108(1):175-86.
doi: 10.1152/jn.00098.2012. Epub 2012 Apr 11.

The function and molecular identity of inward rectifier channels in vestibular hair cells of the mouse inner ear

Affiliations

The function and molecular identity of inward rectifier channels in vestibular hair cells of the mouse inner ear

Michaela E Levin et al. J Neurophysiol. 2012 Jul.

Abstract

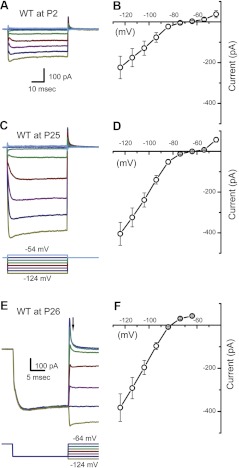
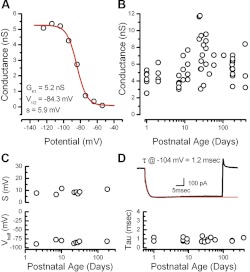
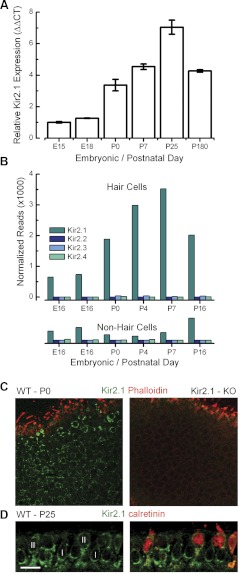
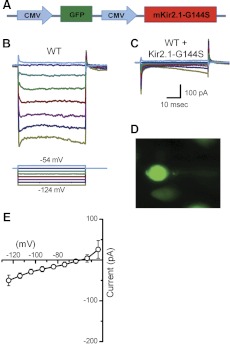
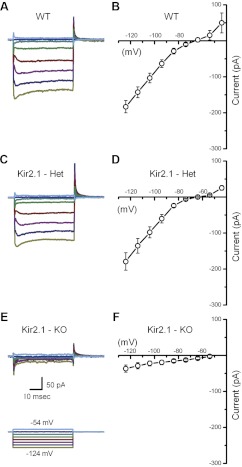
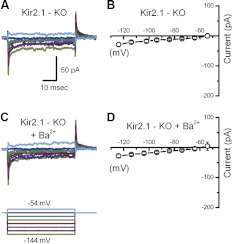
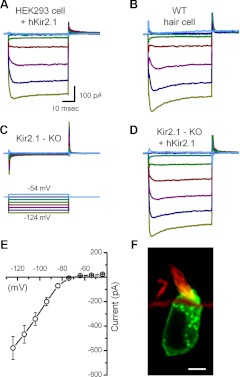
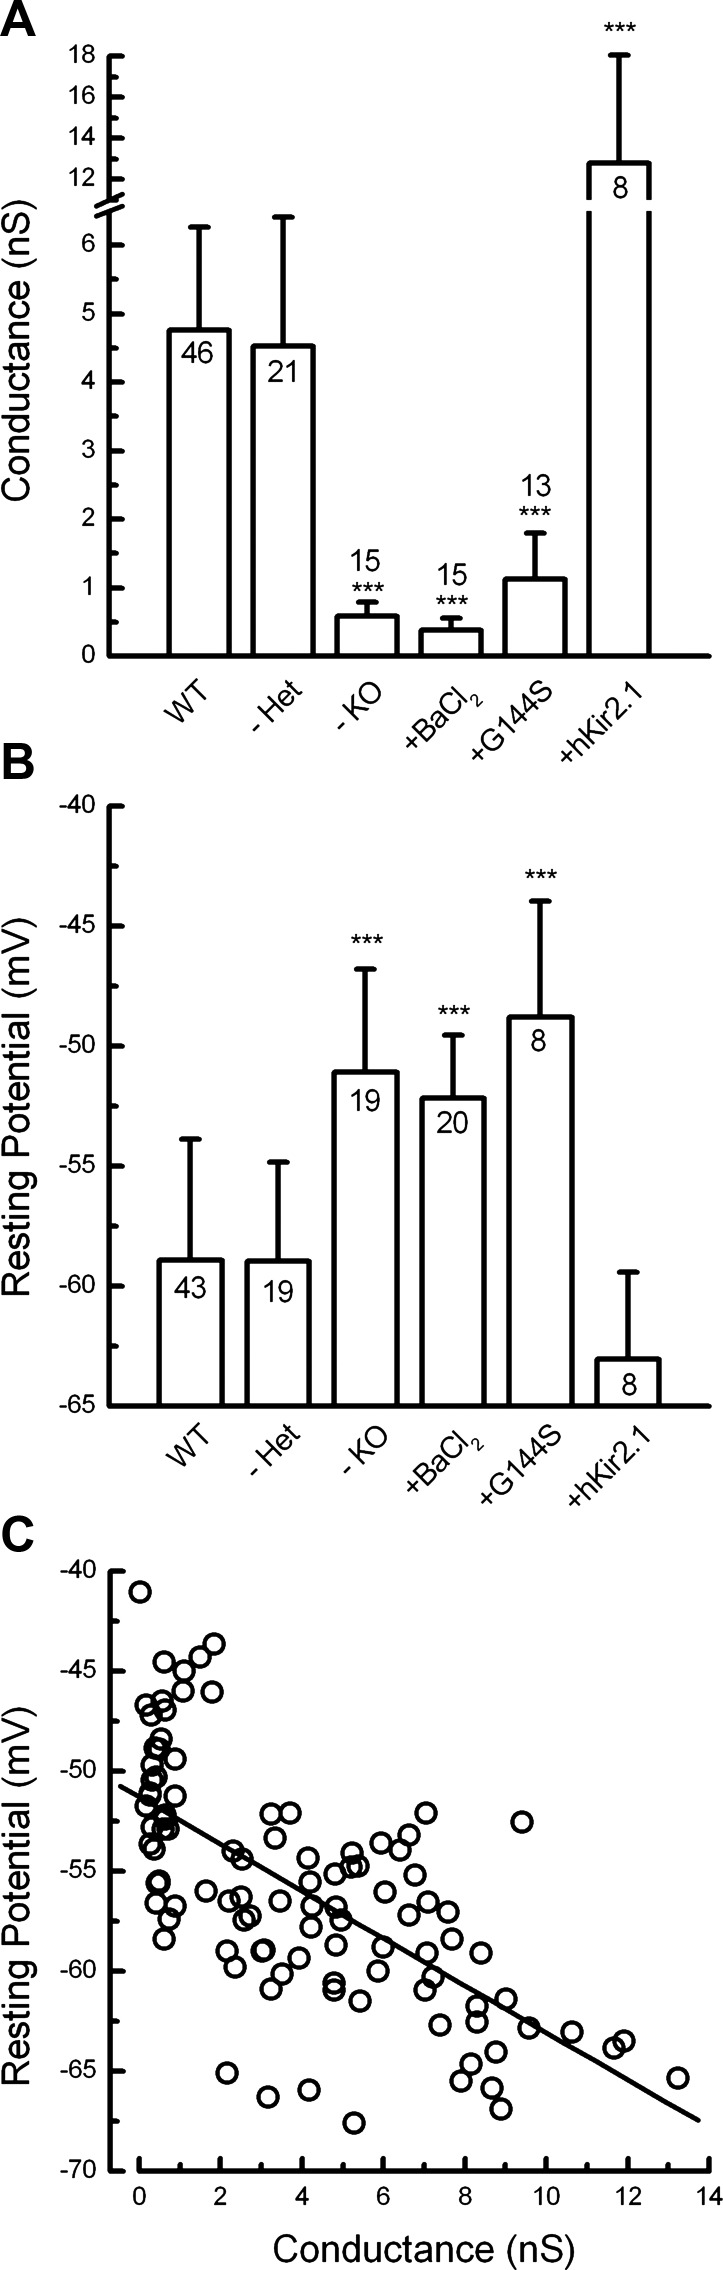
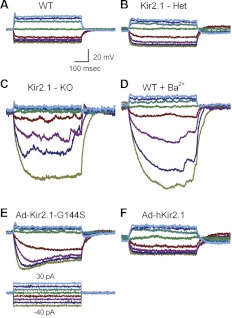
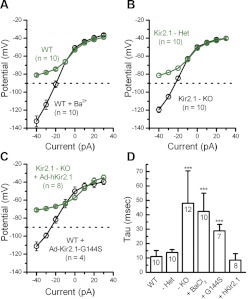
Inner ear hair cells respond to mechanical stimuli with graded receptor potentials. These graded responses are modulated by a host of voltage-dependent currents that flow across the basolateral membrane. Here, we examine the molecular identity and the function of a class of voltage-dependent ion channels that carries the potassium-selective inward rectifier current known as I(K1). I(K1) has been identified in vestibular hair cells of various species, but its molecular composition and functional contributions remain obscure. We used quantitative RT-PCR to show that the inward rectifier gene, Kir2.1, is highly expressed in mouse utricle between embryonic day 15 and adulthood. We confirmed Kir2.1 protein expression in hair cells by immunolocalization. To examine the molecular composition of I(K1), we recorded voltage-dependent currents from type II hair cells in response to 50-ms steps from -124 to -54 in 10-mV increments. Wild-type cells had rapidly activating inward currents with reversal potentials close to the K(+) equilibrium potential and a whole-cell conductance of 4.8 ± 1.5 nS (n = 46). In utricle hair cells from Kir2.1-deficient (Kir2.1(-/-)) mice, I(K1) was absent at all stages examined. To identify the functional contribution of Kir2.1, we recorded membrane responses in current-clamp mode. Hair cells from Kir2.1(-/-) mice had significantly (P < 0.001) more depolarized resting potentials and larger, slower membrane responses than those of wild-type cells. These data suggest that Kir2.1 is required for I(K1) in type II utricle hair cells and contributes to hyperpolarized resting potentials and fast, small amplitude receptor potentials in response to current inputs, such as those evoked by hair bundle deflections.


Figures

Fig. 1.
Fig. 1.
IK1 carries the potassium-selective inward rectifier current in mouse utricle hair cells. A: representative currents from a postnatal day 2 (P2) type II hair cell reveal voltage-dependent K+ inward rectifier currents of the IK1 variety. Currents were evoked by the protocol shown at the bottom of C, which included voltage steps in 10-mV increments between −54 and −124 mV from a holding potential of −64 mV. WT, wild-type. B: mean steady-state I(V) curve derived from current families, such as the one shown in A, for 5 P2 hair cells. C: a representative family of currents from a P25 type II hair cell. The scale bar shown in A also applies to C. D: mean steady-state I(V) curve derived from current families of 6 P25–P29 hair cells. E: a family of IK1 traces, evoked by the protocol (bottom), designed to facilitate estimation of the IK1 reversal potential. From the holding potential of −64 mV, the cell was hyperpolarized to −114 mV to fully activate IK1 and then stepped to a series of voltages between −124 and −54 mV. F: mean instantaneous I(V) generated from 9 P24–P31 hair cells. Currents were sampled at the time point indicated by the arrow in E. Reversal potential was taken as the 0 current potential of the instantaneous I(V) relation.
Fig. 2.
Fig. 2.
Activation range and developmental expression of IK1. A: a representative activation curve recorded from a P9 wild-type type II hair cell. The data were fit with a Boltzmann equation with a membrane potential at which 1/2 of the conductance is activated (V1/2) of −84 mV, a slope (s) of 5.9 mV, and a maximal conductance (GK1) of 5.2 nS. B: maximal inward rectifier conductances from type II hair cells plotted as function of age. The data were plotted on a log scale to help spread the data along the x-axis. C: slope and V1/2 values derived from 8 representative Boltzman fits plotted as a function of postnatal age. D: activation kinetics at −104 mV fitted with a single exponential (red trace). Bottom: the time constants (tau; τ) are plotted as a function of postnatal age for 20 representative cells.
Fig. 3.
Fig. 3.
Expression of Kir2 subunits in mouse utricle. A: quantitative RT-PCR was used to estimate mRNA expression of Kir2.1 at various time points. The number of wild-type mouse utricles used to derive the template mRNA included: embryonic day 15 (E15) = 20, E18 = 15, P0 = 24, P7 = 14, P25 = 30, P180 = 14. Error bars represent SE for 3 replicates. CT, comparative threshold. B: normalized number of mRNA reads plotted as a function of age for hair cells and nonhair cells. Transcript counts are plotted for Kir2.1–Kir2.4. Two replicates are shown for the E16 sample. Data provided courtesy of Drs. Zheng-Yi Chen and David P. Corey (https://shield.hms.harvard.edu). C: confocal images of utricles at P0 from wild-type (left) and Kir2.1-deficient [Kir2.1−/−; knockout (KO)] mice (right). Projections through a series of focal planes through the epithelium show that Kir2.1 (green) is expressed in the basolateral membrane of hair cells but not in stereocilia stained with phalloidin (red). D: confocal image of a cross-section through an extrastriolar region of a wild-type P25 mouse utricle. The tissue was immunolabeled for Kir2.1 (green) and calretinin (red). Type I (I) and type II (II) hair cells are indicated in the figure. Original scale bar = 10 μm. Image provided courtesy of Dr. Anna Lysakowski and Mr. Steven Price.
Fig. 4.
Fig. 4.
Adenoviral expression of dominant-negative Kir2.1 in wild-type utricle hair cells. A: adenoviral vector map for adenovirus (Ad)-murine (m)Kir2.1-G144S. The vector includes the coding sequence for Kir2.1 carrying a point mutation (G144S) in the conical GYG selectivity filter. Promoter sequences [cytomegalovirus (CMV)] are shown in blue, green fluorescent protein (GFP) in green, and the coding sequences for Kir2.1 in red. B: representative currents recorded from a wild-type cell at P7 (GFP-negative). The scale bar in C also applies to B. The stimulus protocol for recordings in B and C, shown at the bottom of B. C: data from a GFP-positive cell transfected with a dominant-negative Kir2.1 (G144S) construct. The data were recorded from the same tissue as the data shown in B (+3 days in culture). D: image of the GFP-positive cell recorded from C. E: mean I(V) curve sampled near the end of the voltage steps, derived from 6 GFP-positive cells transfected with Ad-Kir2.1-G144S.
Fig. 5.
Fig. 5.
Inward rectifier currents recorded from Kir2.1 knockout mice. A and C: representative currents recorded from wild-type and heterozygous (Het) cells at P2. B: mean steady-state I(V) relation taken from 10 P0–P1 wild-type cells. D: mean steady-state I(V) relation taken from 6 P2 cells from heterozygous (Kir2.1+/−) mice. E: a family of representative currents recorded from a utricle type II hair cell excised from a Kir2.1−/− mouse at P0 and maintained in culture for 2 days. The stimulus protocol and scale bars shown below E also apply to A and C. F: mean steady-state I(V) relation taken from 8 P0 hair cells from Kir2.1−/− mice.
Fig. 6.
Fig. 6.
Current families recorded in the presence of BaCl2. A: current traces recorded from a Kir2.1−/− type II hair cell at P1 prior to application of BaCl2. The scale bar applies to A and C. B: mean steady-state I(V) relation taken from the 5 Kir2.1−/− cells prior to bath application of BaCl2. C: currents recorded from the same cell shown in A after bath application of 100 μM BaCl2, a pan-Kir2 blocker. The voltage protocol at the bottom applies to A and C. D: mean steady-state I(V) relation taken from the same 5 cells of B after application of 100 μM BaCl2.
Fig. 7.
Fig. 7.
Adenoviral expression of wild-type human (h)Kir2.1 in human embryonic kidney (HEK) cells and Kir2.1−/− hair cells. A: representative traces recorded from a GFP-positive HEK cell transfected with hKir2.1. The scale bar applies to A–D. B: representative traces recorded from a wild-type type II hair cell excised at P0 and maintained in culture for 3 days. C: traces recorded from a GFP-negative Kir2.1−/− cell. The tissue was excised at P0, exposed to Ad-hKir2.1 for 24 h, and maintained in culture for 3 days. The voltage protocol applies to panels A–C. D: a representative family of currents recorded from a GFP-positive cell from the same tissue as described for C. E: mean I(V) relationship sampled near the end of the voltage steps derived from 8 GFP-positive Kir2.1−/− cells, transfected with hKir2.1. F: confocal image of a type II hair cell transfected with hKir2.1::GFP, counterstained with rhodamine-phalloidin. Original scale bar = 5 μm.
Fig. 8.
Fig. 8.
Summary of conductance and resting potential data. A: mean maximal inward rectifier conductance measured from utricle type II hair cells under the experimental conditions labeled at the bottom of the x-axis: Kir2.1 heterozygotes (−Het), Kir2.1 homozygotes (−KO), wild-type + 100 μM BaCl2 (+BaCl2), wild-type transfected with Ad-mKir2.1-G144S (+G144S), and Kir2.1 homozygotes transfected with wild-type hKir2.1 (+hKir2.1). Error bars indicate SD. ***P < 0.001 relative to wild-type cells. The number of samples for each bar is indicated on the graph. B: mean resting potentials for the same experimental conditions indicated in A. Error bars indicate SD. ***P < 0.001 relative to wild-type cells. The number of samples for each bar is indicated on the graph. C: scatter plot of resting potential as a function of inward rectifier conductance derived from the data shown in A and B. All data under all conditions, for which we had both measurements from the same cell, are plotted (n = 103 cells). The data were fit with a linear regression (diagonal line), which had a slope of −1.2 mV/nS, a y-intercept of −51 mV, and a correlation coefficient of 0.66.
Fig. 9.
Fig. 9.
Membrane responses recorded in current-clamp mode under various experimental conditions. Membrane potentials were evoked in type II hair cells by current steps that ranged from −40 to 30 pA in 10 pA. The voltage protocol shown at the bottom of E and the scale bars shown in A apply to all panels. A: representative responses recorded from wild-type cells at P2. B: data recorded from a Kir2.1+/− heterozygous cell at P1. C: membrane potentials recorded from a Kir2.1−/− homozygous cell at P0 + 7 days in culture. D: wild-type cell (P7) exposed to 100 μM BaCl2. E: data from a GFP-positive, wild-type cell transfected with Ad-Kir2.1-G144S for 24 h at P0 and maintained in culture for 12 days. F: data from a GFP-positive Kir2.1−/− hair cell excised at P0, transfected with wild-type Ad-hKir2.1 for 24 h, and maintained in culture for 3 days.
Fig. 10.
Fig. 10.
. Mean voltage-current relationships and membrane time constants measured under various experimental conditions. A: mean V(I) curves extracted from current-clamp responses to current steps between −40 and 30 pA. Responses from 10 cells were measured before (green) and after (black) application of 100 μM BaCl2. Error bars show SE. The dotted line represents −90 mV, the negative limit of the physiological range of membrane potentials. B: mean V(I) relations for 10 Kir2.1+/− cells (green) and 10 Kir2.1−/− cells (black). C: mean V(I) relations for 4 GFP-positive wild-type cells exposed to Ad-Kir2.1-G144S (black) and 8 GFP-positive Kir2.1−/− cells exposed to Ad-hKir2.1 (green). D: mean membrane time constants taken from exponential fits to voltage responses evoked by −40 pA current steps. The various experimental conditions are labeled at the bottom of the x-axis: wild-type (+/+; WT), Kir2.1 heterozygotes (+/−; −Het), Kir2.1 homozygotes (−/−; −KO), wild-type + 100 μM BaCl2 (+BaCl2), wild-type transfected with Ad-Kir2.1-G144S (+G144S), and Kir2.1 homozygotes transfected with wild-type hKir2.1 (+hKir2.1). The number of cells for each group is indicated on the graph. Error bars represent SD. ***P < 0.001 relative to wild-type cells.

Similar articles

Cited by

References

    1. Amalfitano A, Hauser MA, Hu H, Serra D, Begy CR, Chamberlain JS. Production and characterization of improved adenovirus vectors with the E1, E2b, and E3 genes deleted. J Virol 72: 926–933, 1998 - PMC - PubMed
    1. Bao H, Wong WH, Goldberg JM, Eatock RA. Voltage-gated calcium channel currents in type I and type II hair cells isolated from the rat crista. J Neurophysiol 90: 155–164, 2003 - PubMed
    1. Bichet D, Haass FA, Jan LY. Merging functional studies with structures of inward-rectifier K channels. Nat Rev Neurosci 4: 957–967, 2003 - PubMed
    1. Brichta AM, Aubert A, Eatock RA, Goldberg JM. Regional analysis of whole cell currents from hair cells of the turtle posterior crista. J Neurophysiol 88: 3259–3278, 2002 - PubMed
    1. Correia MJ, Wood TG, Prusak D, Weng T, Rennie KJ, Wang HQ. Molecular characterization of an inward rectifier channel (IKir) found in avian vestibular hair cells: cloning, and expression of pKir2.1. Physiol Genomics 19: 155–169, 2004 - PubMed

Publication types

MeSH terms

LinkOut - more resources