. 2012 Apr 11;32(15):5054-61.
doi: 10.1523/JNEUROSCI.4951-11.2012.

A model of toxic neuropathy in Drosophila reveals a role for MORN4 in promoting axonal degeneration

Affiliations

A model of toxic neuropathy in Drosophila reveals a role for MORN4 in promoting axonal degeneration

Martha R C Bhattacharya et al. J Neurosci. .

Abstract

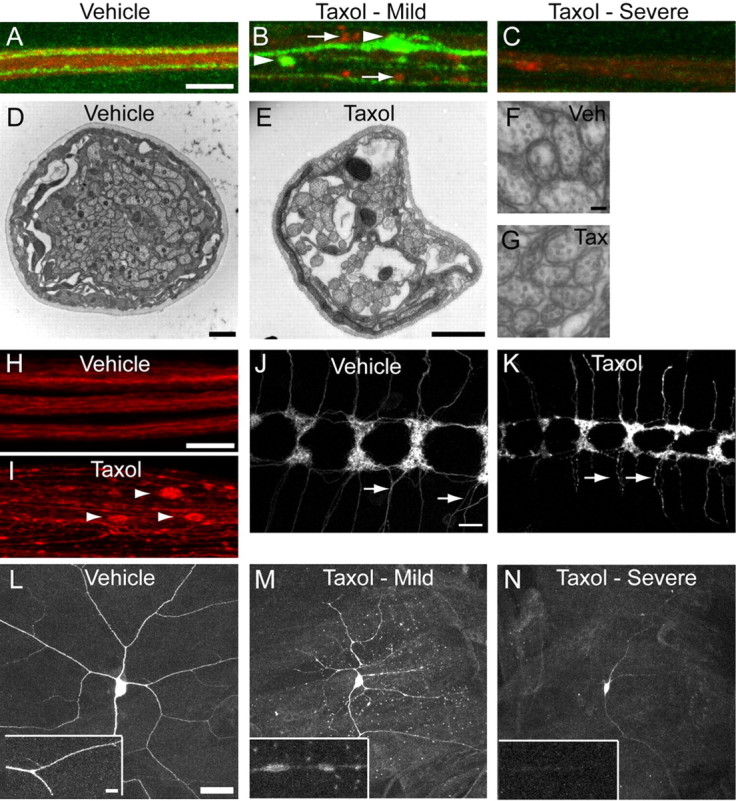
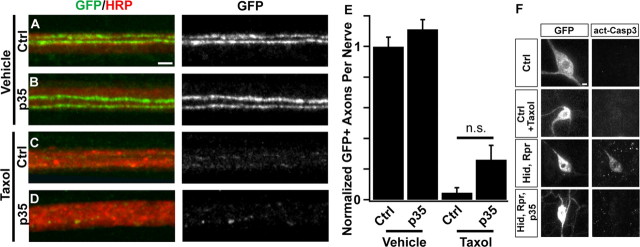
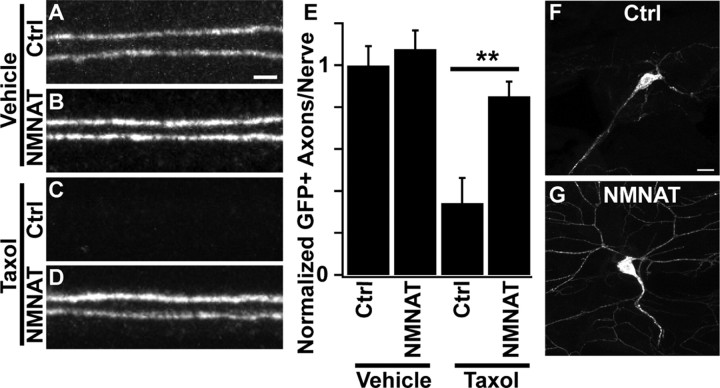
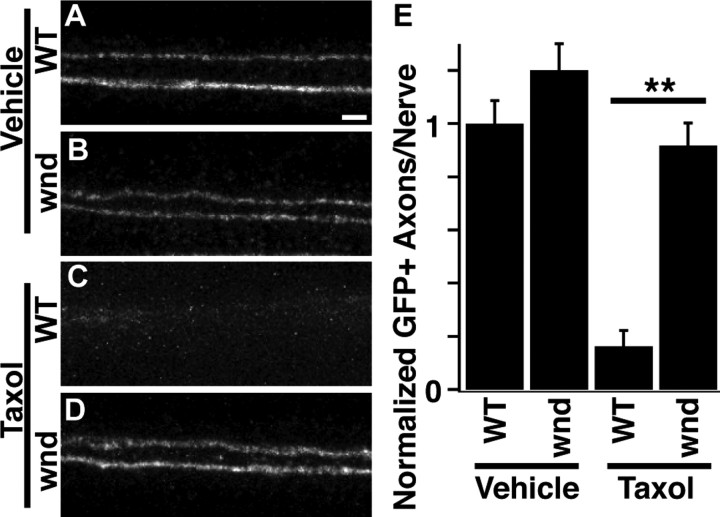
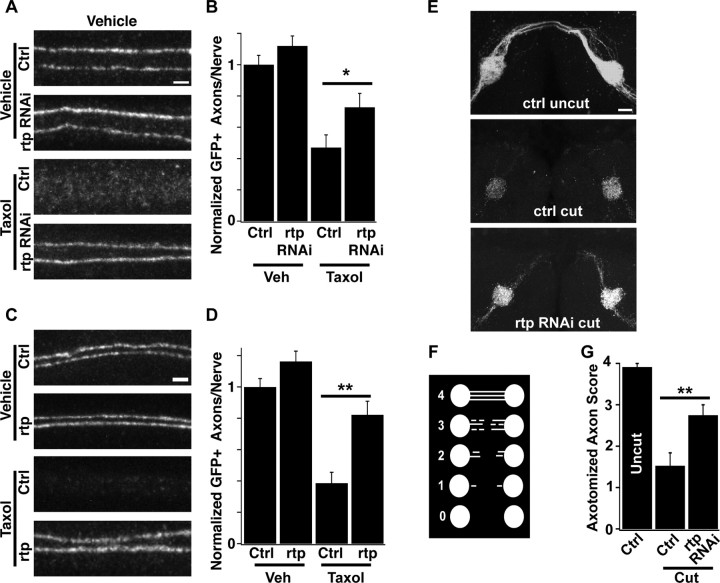
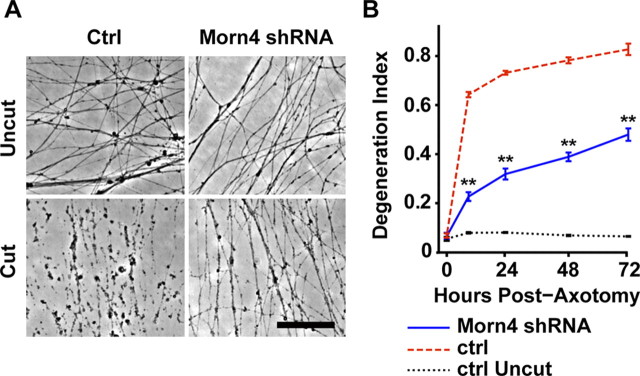
Axonal degeneration is a molecular self-destruction cascade initiated following traumatic, toxic, and metabolic insults. Its mechanism underlies a number of disorders including hereditary and diabetic neuropathies and the neurotoxic side effects of chemotherapy drugs. Molecules that promote axonal degeneration could represent potential targets for therapy. To identify such molecules, we designed a screening platform based on intoxication of Drosophila larvae with paclitaxel (taxol), a chemotherapeutic agent that causes neuropathy in cancer patients. In Drosophila, taxol treatment causes swelling, fragmentation, and loss of axons in larval peripheral nerves. This axonal loss is not due to apoptosis of neurons. Taxol-induced axonal degeneration in Drosophila shares molecular execution mechanisms with vertebrates, including inhibition by both NMNAT (nicotinamide mononucleotide adenylyltransferase) expression and loss of wallenda/DLK (dual leucine zipper kinase). In a pilot RNAi-based screen we found that knockdown of retinophilin (rtp), which encodes a MORN (membrane occupation and recognition nexus) repeat-containing protein, protects axons from degeneration in the presence of taxol. Loss-of-function mutants of rtp replicate this axonal protection. Knockdown of rtp also delays axonal degeneration in severed olfactory axons. We demonstrate that the mouse ortholog of rtp, MORN4, promotes axonal degeneration in mouse sensory axons following axotomy, illustrating conservation of function. Hence, this new model can identify evolutionarily conserved genes that promote axonal degeneration, and so could identify candidate therapeutic targets for a wide-range of axonopathies.


Figures

Figure 1.
Figure 1.
Drosophila peripheral axons are damaged or lost following taxol treatment. A–C, The segmental nerve between segment A3 and A4 is visualized by Cy3-HRP (labels neuronal membranes, red). ppkEGFP labels a subset of sensory neurons. A, Vehicle (DMSO) treated. B, C, 30 μm taxol treated. Axon degeneration was assessed 4 d after treatment initiation. In B, an intermediate phenotype of swellings and fragmentation is visible with both EGFP (arrowheads) and with HRP (arrows). In C, a more severe phenotype of EGFP and HRP loss is shown. Scale bar: (in A) A–D, 5 μm. D, E, EM cross-section images of nerves from wild-type (Canton S) vehicle- and taxol-treated animals. Scale bars: D, E, 1 μm. F, G, Zoomed-in images of axons from D and E. Scale bar (in F) F, G, 200 nm. H, I, Peripheral nerves stained with antibody to Futsch (22C10). Three nerves are shown in the vehicle; one defasciculated nerve is shown in the taxol-treated animal. Arrowheads point to prominent swellings in individual axons. Scale bar (in H), H, I, 10 μm. J, K, Class IV sensory axons (ppkgal4/+; UAS-CD8:GFP/+) in the ventral nerve cord in vehicle (left) and taxol treated (right). Arrows point to intact axons (J) or swollen and fragmenting axons (K). Scale bar: (in J) J, K, 10 μm. L–N, Dendrites and cell body of ddaC sensory neurons in vehicle-treated (L) or 30 μm taxol-treated (M, N) animals. Scale bar: (in L) LN, 30 μm. Insets show portions of a dendrite from the larger images. Scale bar, 6 μm.
Figure 2.
Figure 2.
Axonal degeneration following taxol treatment is independent of apoptosis. A–D, The viral anti-apoptotic protein p35 is unable to rescue sensory axon degeneration. Confocal images of single representative nerves labeled with CD8:GFP (green) and HRP (red). Genotype is ppkgal4/+;UAS-CD8:GFP/+ (Ctrl, A and C) or ppkgal4/UAS-p35;UAS-CD8:GFP/+ (p35, B and D). Animals were fed food containing vehicle (DMSO) (A, B) or taxol (C, D) for 4 d. Scale bar (A), 2 μm. E, Quantification of GFP-labeled axons per nerve remaining after treatment from the genotypes shown in A–D. N = 21, 20, 18, and 16 for the genotypes quantified. NS, Not significant (p > 0.1). F, GFP (left column) and activated caspase 3 (right column) in control larvae (ppkGAL4/+;UAS-CD8:GFP/+) that are untreated (top) or treated with 30 μm taxol (second from top). Bottom two sets of images are controls showing caspase 3 activation following ppkGAL4-driven expression of UAS-hid and UAS-reaper (second from bottom), and loss of caspase 3 activation in flies expressing UAS-hid, UAS-reaper, and UAS-p35 (bottom). Scale bar (F), 3 μm.
Figure 3.
Figure 3.
Overexpression of mouse NMNAT protects axons and dendrites from taxol-induced degeneration. A–D, Confocal images of single representative nerves labeled with ppkEGFP. Genotypes are elavgal4, ppkEGFP/+ (Ctrl, A and C), or UAS-cytNMNAT1/+;elavgal4, ppkEGFP/+ (NMNAT, B and D). Animals were treated with DMSO (A, B) or taxol (C, D) for 4 d and then analyzed. Scale bar (A), 2 μm. E, Quantification of GFP-labeled axons per nerve following taxol treatment in the genotypes shown in A–D. N = 10, 17, 17, and 22 for the genotypes quantified. **p < 0.01. F, G, Dendrites and cell bodies of ddaC neurons treated with taxol from control (same genotype as A and C) and UAS-cytNMNAT1-expressing (same genotype as B and D) animals. Scale bar (F), 10 μm.
Figure 4.
Figure 4.
Wallenda is required for taxol-induced axonal degeneration in Drosophila. A–D, Confocal images of single representative nerves labeled with ppkEGFP. Animals were treated with DMSO (A, C) or taxol (B, D) for 4 d and then analyzed. WT genotype is heterozygous wnd3/+; wnd genotype is wnd3/wnd2. A, Wild-type vehicle; B, wnd mutant vehicle; C, wild-type taxol; D, wnd mutant taxol. Scale bar (A), 2 μm. E, Quantification of axonal preservation in the genotypes shown in A–D. N = 54, 54, 58, and 77 for genotypes quantified. **p < 0.01.
Figure 5.
Figure 5.
Retinophilin promotes axonal degeneration. A, Comparison of GFP-labeled axonal maintenance with knockdown of retinophilin in vehicle-treated (top two images) or taxol-treated animals (bottom two images). Genotypes are UAS-DCR/+;elavGAL4, ppkEGFP/+ (Ctrl) and UAS-DCR/+;UAS-rtpRNAi/+;elavGAL4, ppkEGFP/+ (rtp RNAi). Scale bar, 2 μm. B, Quantification of rtp RNAi and control axons as shown in A. For the graph, N = 23, 26, 38, and 33 nerves for each genotype and treatment. *p < 0.05 between taxol-treated groups, Student's t test. C, Images of GFP-labeled axons in vehicle-treated (top two images) or taxol-treated animals (bottom two images) that are of the genotypes ppkCD8GFP/+ (Ctrl) or ppkCD8GFP/+;rtp1/retin1 (rtp). D, Quantification of rtp mutant and control axons as shown in C. For the graph, N = 58, 37, 51, and 40 nerves for each genotype and treatment. **p < 0.01. E, Representative images of olfactory axons. All are labeled with Or82a-gal4,UAS-CD8:GFP. Top, Uncut control (no RNAi); middle, cut control; bottom, rtp RNAi expressed by Or82a-gal4. Scale bar, 15 μm. F, Schematic of quantification scheme for olfactory axotomies. A score of 0 indicates the lack of any detectable axons outside of glomeruli; a score of 4 indicates that axons reach and cross the central commissure. Scores of 1–3 rank axons by number and length of remaining axons or axonal fragments. G, Axotomy scores of the genotypes shown in C. N = 18, 12, and 10 for genotypes quantified. **p < 0.01.
Figure 6.
Figure 6.
Mouse Morn4 participates in axonal degeneration. A, Representative images of axons from cultured mouse DRG neurons infected with shRNAs targeting luciferase (ctrl) or Morn4. Axons are uncut (top images) or 24 h post-axotomy (bottom images). Scale bar, 100 μm. B, Quantification of degeneration index of control shRNA (red trace)- or Morn4 shRNA (blue trace)-infected axons at 0, 9, 24, 48, and 72 h post-axotomy, and uncut control shRNA-infected axons (black trace). Double asterisks indicate p < 0.001 between cut control shRNA and Morn4 shRNA.

References

    1. Araki T, Sasaki Y, Milbrandt J. Increased nuclear NAD biosynthesis and SIRT1 activation prevent axonal degeneration. Science. 2004;305:1010–1013. - PubMed
    1. Babetto E, Beirowski B, Janeckova L, Brown R, Gilley J, Thomson D, Ribchester RR, Coleman MP. Targeting NMNAT1 to axons and synapses transforms its neuroprotective potency in vivo. J Neurosci. 2010;30:13291–13304. - PMC - PubMed
    1. Barrientos SA, Martinez NW, Yoo S, Jara JS, Zamorano S, Hetz C, Twiss JL, Alvarez J, Court FA. Axonal degeneration is mediated by the mitochondrial permeability transition pore. J Neurosci. 2011;31:966–978. - PMC - PubMed
    1. Bradley DA, Hussain M. Promising novel cytotoxic agents and combinations in metastatic prostate cancer. Cancer J. 2008;14:15–19. - PubMed
    1. Coleman M. Axon degeneration mechanisms: commonality amid diversity. Nat Rev Neurosci. 2005;6:889–898. - PubMed

Publication types

MeSH terms