. 2012 Apr 11;32(15):5106-19.
doi: 10.1523/JNEUROSCI.6320-11.2012.

Dopamine modulation of Ih improves temporal fidelity of spike propagation in an unmyelinated axon

Affiliations

Dopamine modulation of Ih improves temporal fidelity of spike propagation in an unmyelinated axon

Aleksander W Ballo et al. J Neurosci. .

Abstract

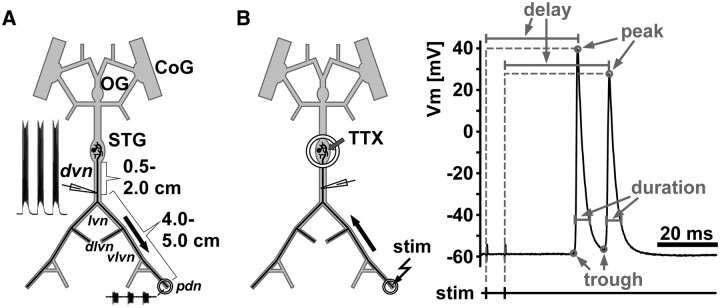
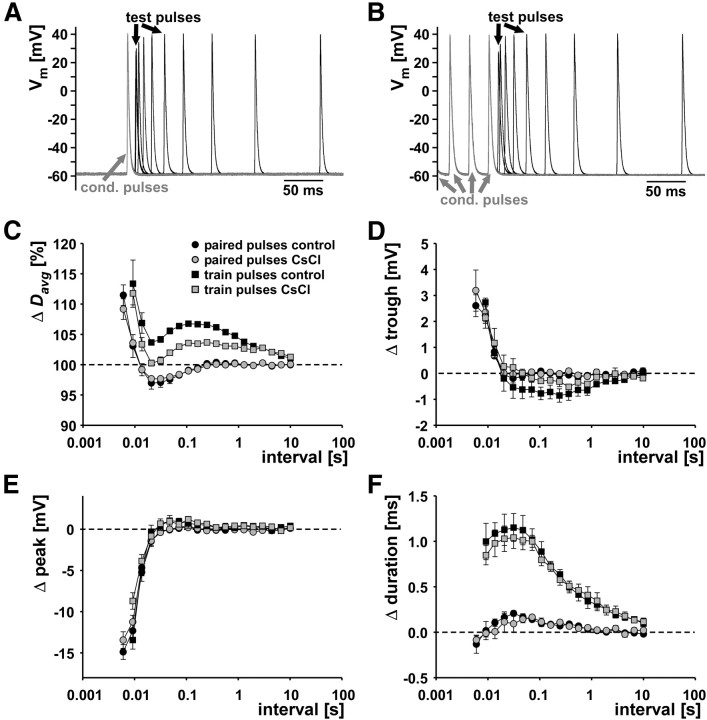
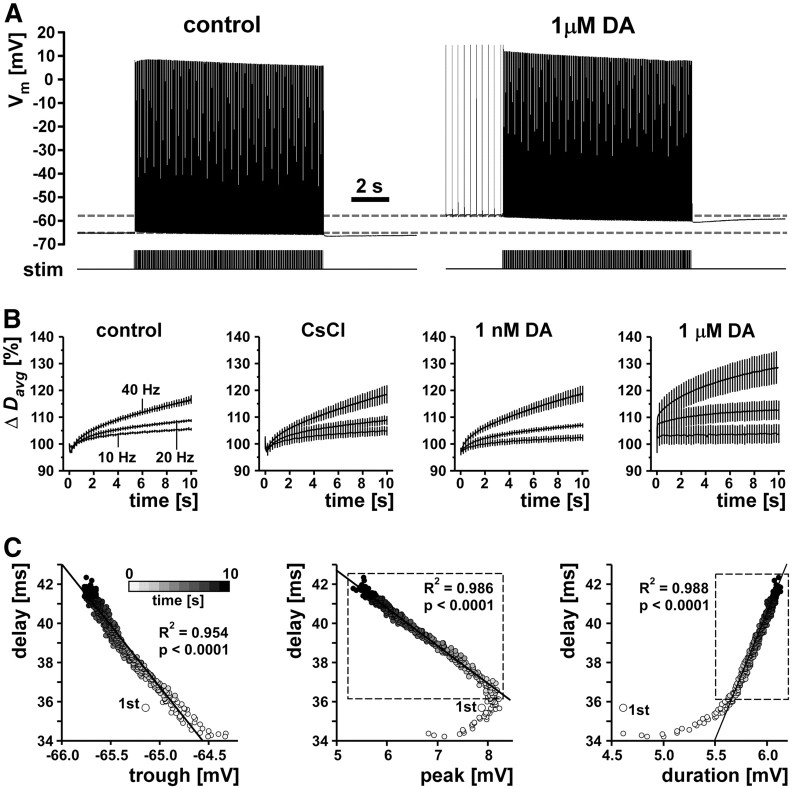
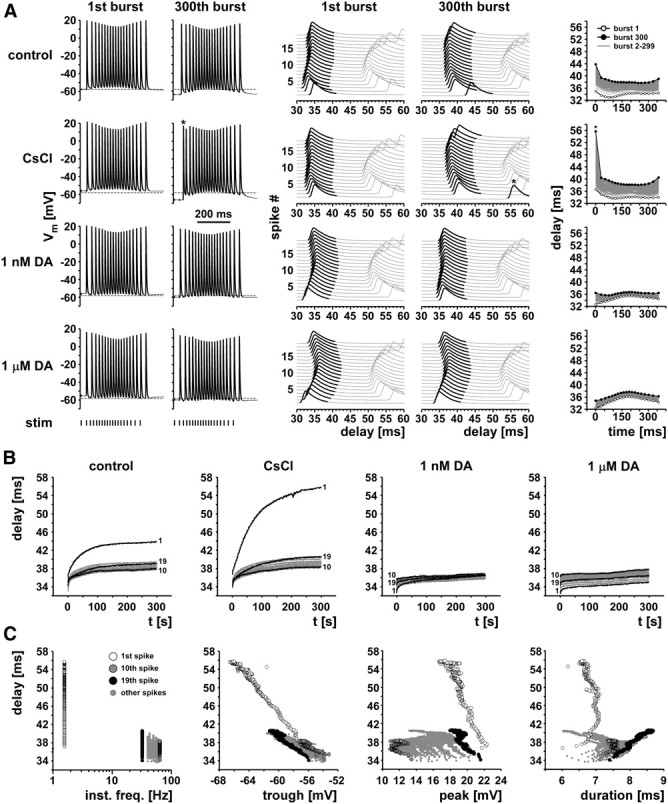
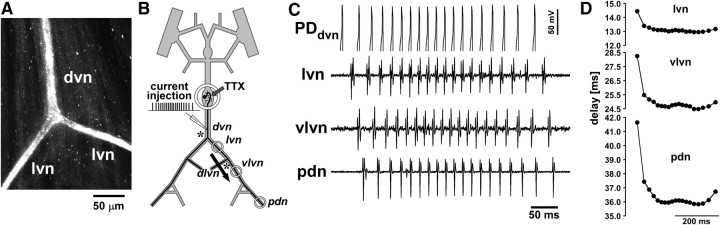
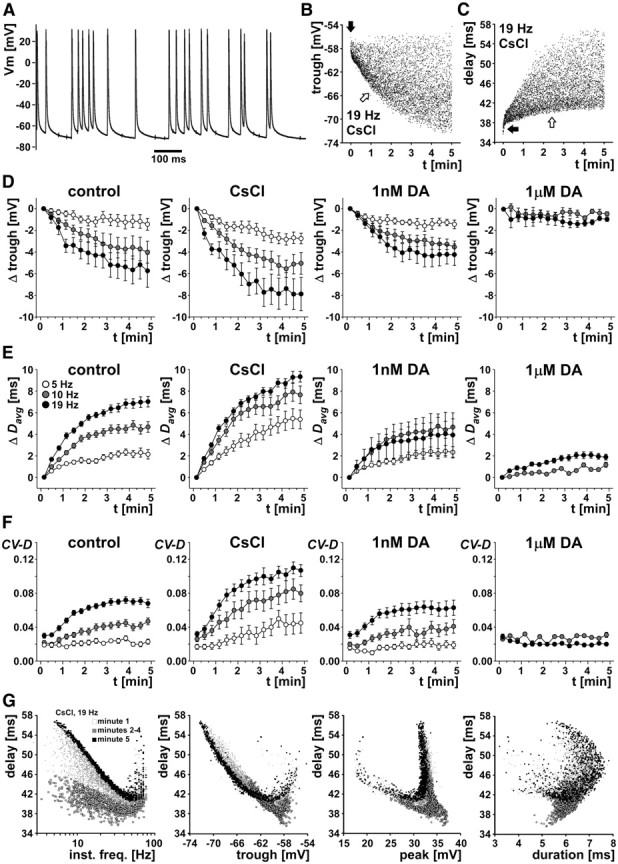
We studied how conduction delays of action potentials in an unmyelinated axon depended on the history of activity and how this dependence was changed by the neuromodulator dopamine (DA). The pyloric dilator axons of the stomatogastric nervous system in the lobster, Homarus americanus, exhibited substantial activity-dependent hyperpolarization and changes in spike shape during repetitive activation. The conduction delays varied by several milliseconds per centimeter, and, during activation with realistic burst patterns or Poisson-like patterns, changes in delay occurred over multiple timescales. The mean delay increased, whereas the resting membrane potential hyperpolarized with a time constant of several minutes. Concomitantly with the mean delay, the variability of delay also increased. The variability of delay was not a linear or monotonic function of instantaneous spike frequency or spike shape parameters, and the relationship between these parameters changed with the increase in mean delay. Hyperpolarization was counteracted by a hyperpolarization-activated inward current (I(h)), and the magnitude of I(h) critically determined the temporal fidelity of spike propagation. Pharmacological block of I(h) increased the change in delay and the variability of delay, and increasing I(h) by application of DA diminished both. Consequently, the temporal fidelity of pattern propagation was substantially improved in DA. Standard measurements of changes in excitability or delay with paired stimuli or tonic stimulation failed to capture the dynamics of spike conduction. These results indicate that spike conduction can be extremely sensitive to the history of axonal activity and to the presence of neuromodulators, with potentially important consequences for temporal coding.


Figures

Figure 1.
Figure 1.
Schematic of recording arrangements. A, The STNS during normal ongoing pyloric activity. Intracellular axon recordings were obtained from the dvn, 0.5–2 cm distal to the STG. PD axons were identified by their characteristic waveform and correspondence of spike patterns with a distal extracellular recording from the pdn. Only one of the two bilaterally projecting PD neurons is shown. CoG, Commissural ganglion; OG, esophageal ganglion. B, Antidromic stimulation and quantification of spike waveform parameters. For patterned stimulation and quantification of delay and waveform parameters, centrally generated rhythmic activity was blocked by applying 1 μm TTX to a petroleum jelly well built around the STG. Spikes were then elicited by electrically stimulating the pdn through the extracellular electrodes. The example trace indicates the measurements taken. Peaks were detected as voltage maxima in the intracellular recording, and the delay from stimulation to peak was measured. Troughs were detected as voltage minima between spikes or immediately before a spike. Voltage values of both peaks and troughs, as well as the spike duration (at 16 of the amplitude) were measured.
Figure 2.
Figure 2.
Recovery cycle measurements. A, Overlaid traces from paired-pulse stimulation with different intervals in control saline. Conditioning pulses are shown in gray. B, Overlaid traces from conditioning trains and test pulses at different intervals in control saline. Only the last three conditioning pulses from a 10 s/10 Hz stimulation are shown in gray. C, Percentage change in delay (Δ Davg) as a function of interval for paired pulses and conditioning trains in control saline and 5 mm CsCl (n = 3). 100% is the delay value for the conditioning pulse in the paired-pulse protocol and the first pulse in the train protocol. D–F, Difference in voltage spike shape parameters as a function of stimulus interval.
Figure 3.
Figure 3.
Conduction delay changes during tonic stimulation. A, Example traces from 10 s/40 Hz stimulations in control saline and 1 μm DA. B, Plots of mean change in delay (Δ Davg) over the 10 s stimulation for three different tonic stimulation frequencies (10, 20, 40 Hz) in control, CsCl, and the two DA concentrations (n = 5). For legibility, only one in eight error bars are shown. C, Delay as a function of spike shape (example plots from 1 experiment in control saline). Gray shading indicates time bins from 1–10 s. Values from the first stimulus are plotted as larger dots and labeled “1st.” Lines represent linear fits from regression analysis, and R2 and p values are given in the figure. For the correlation between peak voltage and delay, and spike duration and delay, only data from the 2nd to 10th second were used (dashed box).
Figure 4.
Figure 4.
Delay changes during realistic burst stimulations. A, Example traces from one experiment. The left panel shows the first and 300th burst of 5 min stimulations with a realistic burst pattern (19 pulses, parabolic instantaneous frequency structure). Note the differences in baseline hyperpolarization from the 1st to 300th burst across control, CsCl, and the two DA concentrations. The middle panel shows the same data as staggered multiple sweeps, triggered at the stimulus time. Note the substantial change in delay over the course of the 300th burst in control and CsCl, particularly for the first spike (asterisk in the CsCl traces). The right panel shows plots of delay over burst time for all 300 bursts in each treatment. B, Delay over time of the entire 5 min stimulation for the same experiment shown in A. The 1st, 10th, and 19th spike are shown in black, and all others are in gray. C, Delay as a function of instantaneous frequency and spike shape parameters in CsCl. Different symbols indicate different spike indices.
Figure 5.
Figure 5.
Mean values for burst stimulation results (n = 9, n = 5 for wash). For legibility, only one in five error bars are shown in all plots. A, Change of trough voltage over the 5 min stimulation. B, Change of Davg over the 5 min stimulation. C, Change of CV-D over the 5 min stimulation. CV-D was calculated for each burst separately, including the delays of all spikes. D, The change of the temporal pattern of the 300th burst in each treatment. The original pulse structure at stimulation is shown in gray. For each spike index, the mean latency to the intracellular recording site is shown. Note the substantial increase in spike frequency at the beginning of the burst in control and CsCl.
Figure 6.
Figure 6.
Changes in delay during orthodromic propagation. A, Confocal image of the dvn/lvn branch point of the PD axon. The axon was stained with Alexa Fluor 568 hydrazide several millimeters proximal to the branch point. B, Schematic of the recording arrangement for intracellular stimulation from the dvn and extracellular recordings along the motor nerves. Axon branch points are indicated by asterisks. C, The 300th burst of a 5 min stimulation protocol identical to those shown in Figures 4 and 5, evoked by brief depolarizing pulses through the intracellular electrode. The intracellular recording was not balanced for current injection but clearly shows the peaks of evoked spikes. The delays to the spikes in the extracellular recordings show the propagation direction from dvn to pdn. D, Propagation delay between dvn and the three extracellular recording sites for all spikes in the 300th burst. Measurements were taken from the recording traces shown in C. Note that there is a branch point between dvn and lvn and another branch point between lvn and vlvn but none between vlvn and pdn.
Figure 7.
Figure 7.
Randomized (Poisson-like) stimulations. A, Section of an intracellular recording of a PD axon in the dvn, stimulated with a Poisson-like pattern for 5 min. B, Trough voltage values for an example experiment for 5 min stimulation time with a mean frequency of 19 Hz in CsCl. Trough voltage showed an initial rapid hyperpolarization (black arrow), followed by slower hyperpolarization (white arrow). C, Delay values over stimulation time for the same experiment. Delay showed an initial rapid increase (black arrow), followed by a slower increase (white arrow). D, E, Change in mean trough voltage and Davg for three mean stimulation frequencies (5, 10, and 19 Hz). Data are from five experiments, and points from each experiment were obtained by calculating mean values from 20 s bins. Because of substantial spontaneous peripheral spike initiation in 1 μm DA, no data were obtained for 5 Hz mean stimulation frequency. F, CV-D over time. G, Delay as a function of instantaneous stimulation frequency and spike shape parameters. Data shown are from the same experiment and treatment as in B and C. Different symbols indicate different times during the stimulation protocol. Note the absence of any linear or monotonic relationships.

References

    1. Adrian ED. The recovery process of excitable tissues. Part II. J Physiol. 1921;55:193–225. - PMC - PubMed
    1. Avoli M, Methot M, Kawasaki H. GABA-dependent generation of ectopic action potentials in the rat hippocampus. Eur J Neurosci. 1998;10:2714–2722. - PubMed
    1. Baginskas A, Palani D, Chiu K, Raastad M. The H-current secures action potential transmission at high frequencies in rat cerebellar parallel fibers. Eur J Neurosci. 2009;29:87–96. - PubMed
    1. Bähner F, Weiss EK, Birke G, Maier N, Schmitz D, Rudolph U, Frotscher M, Traub RD, Both M, Draguhn A. Cellular correlate of assembly formation in oscillating hippocampal networks in vitro. Proc Natl Acad Sci U S A. 2011;108:E607–E616. - PMC - PubMed
    1. Baker MD. Axonal flip-flops and oscillators. Trends Neurosci. 2000;23:514–519. - PubMed

Publication types

MeSH terms

LinkOut - more resources