. 2012 Apr 11;32(15):5298-309.
doi: 10.1523/JNEUROSCI.0227-12.2012.

Distinct dendritic spine and nuclear phases of calcineurin activation after exposure to amyloid-β revealed by a novel fluorescence resonance energy transfer assay

Affiliations

Distinct dendritic spine and nuclear phases of calcineurin activation after exposure to amyloid-β revealed by a novel fluorescence resonance energy transfer assay

Hai-Yan Wu et al. J Neurosci. .

Abstract

Calcineurin (CaN) activation is critically involved in the regulation of spine morphology in response to oligomeric amyloid-β (Aβ) as well as in synaptic plasticity in normal memory, but no existing techniques can monitor the spatiotemporal pattern of CaN activity. Here, we use a spectral fluorescence resonance energy transfer approach to monitor CaN activation dynamics in real time with subcellular resolution. When oligomeric Aβ derived from Tg2576 murine transgenic neurons or human AD brains were applied to wild-type murine primary cortical neurons, we observe a dynamic progression of CaN activation within minutes, first in dendritic spines, and then in the cytoplasm and, in hours, in the nucleus. CaN activation in spines leads to rapid but reversible morphological changes in spines and in postsynaptic proteins; longer exposure leads to NFAT (nuclear factor of activated T-cells) translocation to the nucleus and frank spine loss. These results provide a framework for understanding the role of calcineurin in synaptic alterations associated with AD pathogenesis.


Figures
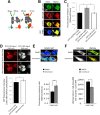
Figure 1.
Figure 1.
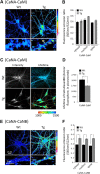
FRET efficiency between CaNA–CaM or CaN-CaNB represents CaN activation in HEK cells. A, FRET strategy that was used for detection of CaN–CaM interaction. B, Images of HEK cells transiently transfected with GFP-CaM and RFP-CaNA for 24 h. Cells were excited at GFP-specific excitation wavelength (488 nm). The FRET ratios were calculated by reporting emission intensity of RFP, measured at 565 nm, to the GFP emission peak measured at 522 nm. The pseudocolored ratio images (FRET images) represent the emission changes before (time, 0 min) and 30 min after the addition of 2 μm ionomycin. Cells treated with ionomycin for 30 min showed higher FRET compared with 0 min. The color scale (bottom right) indicates that a shift toward the red end of the spectrum corresponds to higher FRET efficiency. C, Quantitative analysis of normalized FRET ratio in HEK cells transiently transfected with GFP-CaM and RFP-CaNA for 24 h and treated with 2 μm ionomycin for 30 min. No change is detected when the donor alone (GFP-CaM) was transfected. D, To confirm the existence of a FRET signal between GFP-CaM and RFP-CaN, a photobleach experiment was performed. HEK cells were transfected with both GFP-CaM and RFP-CaNA and treated for 30 min with ionomycin. After fixation, the RFP fluorescent signal of a small cytoplasmic region of interest was photobleached with 100% excitation light at 543 nm for 5 min (top panel, yellow boxes), and the intensity of the GFP signal was measured before and after bleaching. As a control, the GFP intensity was quantified in nonbleached areas as well (top panel, blue boxes). An increase of the GFP-CaM emission intensity was observed in areas where the RFP signal was photobleached, but no change was detected in control areas. E, Endogenous change in FRET signal was quantified by staining the cells for endogenous CaNA-Alexa 488 and endogenous CaM or CaNB-Cy3. The top panel represents pseudocolored ratio images (FRET images) observed in HEK cells treated with ionomycin or DMSO as a vehicle control for 30 min. The bottom panel shows quantitative analysis of normalized spectral ratio (n ≥ 60 cells; *p < 0.05; **p < 0.001). F, FLIM analysis of the interaction between CaNA and CaM in HEK cells treated with 2 μm ionomycin for 30 min. After treatment, cells were stained with endogenous CaNA-Alexa 488 and endogenous CaM-Cy3. The top panel, on the left, shows intensity images of Alexa 488 fluorescence reflecting the pattern of endogenous CaNA. The top panel, on the right, shows pseudocolored FLIM images. The bottom panel shows quantitative FLIM analysis of in HEK cells treated with DMSO and ionomycin. Cells stained with CaNA-Alexa 488 were used as a negative control to establish Alexa 488 lifetime in the absence of an acceptor fluorophore (Cy3) (data not shown). Lifetime is in picoseconds; *p < 0.05; n ≥ 25 cells. Data represent mean ± SEM.
Figure 2.
Figure 2.
Comparison of CaN activation at subcellular level by spectral FRET assay in an in vitro model of AD. A, Representative FRET images of endogenous CaNA-Alexa 488/CaM-Cy3 observed in neurons prepared from wild-type and Tg2576 embryos. B, The bar graph represents the quantitative analysis of normalized spectral ratio (intensity ratio of 565–522 nm) from different neuronal compartments in both Wt and Tg neurons. Neurons from Tg2576 culture had significantly higher FRET between CaNA-Alexa 488 and CaM-Cy3 compared with neurons from wild-type cultures. C, FLIM analysis of the interaction of CaNA–CaM in Wt and Tg2576 neurons. Wt or Tg2576 neurons at 21 DIV were stained with endogenous CaNA-Alexa 488 (donor) and endogenous CaM-Cy3 (acceptor). The left panel shows intensity images of Alexa 488 fluorescence reflecting the pattern of endogenous CaNA. The right panel shows pseudocolored FLIM images. D, Quantitative FLIM analysis of Wt or Tg2576 neurons. Cells stained with CaNA-Alexa 488 were used as a negative control to determine Alexa 488 lifetime in the absence of an acceptor fluorophore (Cy3) (data not shown). Lifetime is in picoseconds. E, Representative FRET images of endogenous CaNA-Alexa 488/CaNB-Cy3 from neurons of wild-type and Tg2576 culture. F, The bar graph represents the quantitative analysis of normalized spectral ratio (intensity ratio of 565–522 nm) from different neuron compartments in both wild-type and Tg2576 neurons. Neurons from Tg2576 culture had significantly higher FRET between CaNA-Alexa 488 and CaNB-Cy3 in the cytosol, nuclei, and spines compared with that of neurons from wild-type cultures. n ≥ 50 cells; *p < 0.05; **p < 0.001. Data represent mean ± SEM.
Figure 3.
Figure 3.
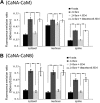
FRET assay reports sustained CaN activation in wild-type neurons treated with Aβ-containing TgCM. A, B, Quantitative analysis of the normalized spectral ratio (intensity ratio of 565–522 nm) shows the extent of FRET from wild-type neurons (21 DIV) treated with Aβ-containing Tg2576 conditioned media for 24 h. Using either endogenous CaNA–CaM (A) and endogenous CaNA–CaNB assay (B), we observed that TgCM treatment leads to higher FRET ratio in cortical neurons compared with wild-type conditioned media. This increase was prevented by immunodepletion of the TgCM with the anti-Aβ antibody, 3D6, but no effect could be detected when 3D6 was previously denatured. n ≥ 60 cells; **p < 0.001. Data represent mean ± SEM.
Figure 4.
Figure 4.
FRET assay from neurons expressing GFP-CaM and RFP-CaNA reports a rapid interaction of CaNA and CaM in dendritic spines induced by Aβ-containing TgCM. Cultured primary neurons at 9 DIV were transfected with GFP-CaM and RFP-CaN. Two weeks after transfection, neurons were incubated with either WtCM (A, B) or TgCM (C, D) for the indicated times. The pseudocolored ratio images show that CaN is activated in live neurons as soon as 15 min after exposure to Aβ in the whole cells and in dendritic spines (C, D). No change is detected when neurons were incubated with WtCM (A, B).
Figure 5.
Figure 5.
Time course of FRET changes in neurons treated with TgCM analyzed from endogenous CaNA/CaNB and CaNA/CaM FRET pairs. Cultured wild-type primary neurons at 24 DIV were treated with TgCM, and then fixed with 4% paraformaldehyde at indicated time points and immunolabeled with endogenous CaNA-Alexa 488 and either CaNB-Cy3 or CaM-Cy3. A, Time-dependent changes of the FRET based on interaction between endogenous CaNA and CaNB. Within 60 min, application of TgCM caused no significant difference in FRET levels of CaNA and CaNB in cytosolic and nuclear compartments (n ≥ 45 cells). However, significantly increased FRET signal between endogenous CaNA and CaNB in spines was detected as early as 15 min after TgCM application and increased with time. **p < 0.01. B, Gaussian distributions show FRET levels of endogenous CaNA and CaNB in spines in resting condition and changes with time in response to TgCM. C, Histograms of FRET values of CaNA and CaNB in response to TgCM application at indicated time points. In resting condition (0 min), the FRET distribution in spine is dominated by a low FRET peak (0.36; top left panel). The FRET distribution was changed from basal to high level with time after application of TgCM. The FRET peak was 0.45 at 15 min (top right panel), 0.48 at 30 min (bottom left panel), and 0.48 at 60 min after TgCM application (bottom right panel). D, Similarly, time-dependent changes of the normalized FRET levels between CaN and CaM show an early increase in spines after 15 min, whereas no difference was observed in both the cytoplasmic and nuclear compartments up to 60 min. E, Gaussian distribution shows CaNA/CaM FRET levels in spines in resting condition and changes with time in response to TgCM. F, Histograms of CaNA/CaM FRET values after 15 min (peak at 0.38; top right panel), 30 min (peak at 0.39; bottom left panel), and 60 min (peak at 0.4; bottom right panel) of TgCM exposure. In both C and F, inset top panels show CaNA-Alexa 488 fluorescent in dendrites and spines and bottom panels show FRET images of dendritic spines. n = 200 spines for each indicated time point; *p < 0.05. Data represent mean ± SEM.
Figure 6.
Figure 6.
Later and sustained CaN activation in response to TgCM application detected by both endogenous CaNA–CaM and CaN-CaNB FRET pairs. A, B, Quantitative analysis of normalized spectral ratio (intensity ratio of 565–522 nm) from different cellular compartments in wild-type neurons treated with TgCM at indicated time points. Significant increases in FRET signal between endogenous CaNA–CaM (A) or CaNA–CaNB (B) in cytoplasm and nucleus was observed at 6 h and lasted at least 24 h. C, D, A reversible interaction of both CaNA–CaM (C) and CaN-CaNB (D) is induced by a brief exposure of neurons with TgCM. A recovery of FRET signals to basal levels is observed when neurons were exposed to Aβ-containing medium for 1 h and washed out for 24 h. CaN activation appear to be reversible. n ≥ 45 cells and n ≥ 200 spines; *p < 0.05; **p < 0.001. Data represent mean ± SEM.
Figure 7.
Figure 7.
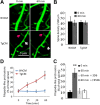
Changes in dendritic spine morphology and decreases in spine F-actin and synaptic surface GluR1 subunit of AMPA receptors occur during rapid CaN activation induced by Aβ-containing TgCM. A, Exposure of wild-type neurons to WtCM or TgCM showed that treatment with TgCM induced a shrinkage of existing spines, as seen by spine length elongation (white arrows) and spine head disappearance (red arrows). B, C, Quantification of spine density (B) and filopodia-like protrusions (percentage of total spines) (C). Aβ exposure for a period of 60 min caused spine length elongation and induced more filopodia-like protrusions without changing spine density. These responses were completely inhibited when TgCM was immunodepleted with 3D6 or when cells were pretreated with 1 μm FK506. D, The increase of filopodia-like protrusions was detected as soon as 15 min after incubation with TgCM. Data are presented as mean ± SEM. **p < 0.001; n = total 200 spines in each condition, from three independent experiments.
Figure 8.
Figure 8.
Exposure of cortical neurons to Aβ-containing medium leads to a reduction of GluR1 intensity at the surface of the dendritic spines. A, Dendrites from neurons treated with wild-type or TgCM for 60 min with or without 3D6 immunodepletion or FK506, and then stained with an antibody to the extracellular N-terminal domain of GluR1 to label surface AMPA receptors, and phalloidin to visualize F-actin. B, Quantification of the effects of oligomeric Aβ on F-actin and surface GluR1 signal intensity (represented as ratios of spines vs shaft). Exposure of neurons to Aβ-containing TgCM reduces the ratios of both phalloidin-stained F-actin and surface GluR1 on the spine to the dendritic shafts, indicating a loss of F-actin and synaptic GluR1 from dendritic spines. This effect is blocked by 3D6 and FK506. Data are presented as mean ± SEM. **p < 0.001; n = total 200 spines in each condition, from three independent experiments.
Figure 9.
Figure 9.
Soluble Aβ oligomers isolated by SEC from human postmortem AD brain induces rapid CaN activation in spines, alters spine morphology, and reduces spine F-actin and synaptic surface GluR1. A, B, Quantitative analysis of normalized spectral ratio (intensity ratio of 565–522 nm) from different neuron compartments in neurons exposed to control or AD SEC fractions with or without 3D6 or FK506. Neurons treated with AD SEC fractions for 60 min show significantly higher FRET of both CaNA–CaM (A) and CaNA–CaNB (B) in spines compared with neurons treated with the comparable SEC fraction from a control brain, whereas FRET signal of CaNA–CaM or CaNA–CaNB in the cytosolic and nuclear compartments was not changed in neurons treated with either control or AD SEC fractions (n ≥ 45 cells and n ≥ 200 spines; **p < 0.001). Data represent mean ± SEM. C, Quantification of filopodia-like protrusions (percentage of total spines). AD SEC fraction exposure for a period of 60 min caused spine length elongation and induced more filopodia-like protrusions. This response was completely inhibited when cells were pretreated with 1 μm FK506 or Tg2576-containing conditioned media was immunodepleted with 3D6. D, Exposure of neurons to oligomeric Aβ-enriched SEC fractions prepared from AD brain samples for 60 min caused no changes in spine density compared with that of neurons exposed to similar SEC fractions prepared from control brain. E, F, Decreases in spine F-actin and synaptic surface GluR1 subunit of AMPA receptors during rapid CaN activation induced by SEC-isolated Aβ oligomers prepared from AD human brains. Neurons treated with AD SEC fraction for 60 min at indicated experimental conditions (with or without 3D6 immunodepletion or in the presence or absence of the CaN inhibitor FK506), and then stained with an antibody to the extracellular N-terminal domain of GluR1 to label surface AMPA receptors, and phalloidin to visualize F-actin (E). Exposure of neurons to SEC-isolated Aβ oligomers prepared from AD human brains reduces the ratios of both phalloidin-stained F-actin and surface GluR1 on the spine to the dendritic shafts, indicating a loss of F-actin and synaptic GluR1 from dendritic spines. This effect was blocked by 3D6 and FK506 (F). n = total 200 spines in each condition, from three independent experiments. **p < 0.001. Data are presented as mean ± SEM.

References

    1. Abdul HM, Sama MA, Furman JL, Mathis DM, Beckett TL, Weidner AM, Patel ES, Baig I, Murphy MP, LeVine H, 3rd, Kraner SD, Norris CM. Cognitive decline in Alzheimer's disease is associated with selective changes in calcineurin/NFAT signaling. J Neurosci. 2009;29:12957–12969. - PMC - PubMed
    1. Allison DW, Chervin AS, Gelfand VI, Craig AM. Postsynaptic scaffolds of excitatory and inhibitory synapses in hippocampal neurons: maintenance of core components independent of actin filaments and microtubules. J Neurosci. 2000;20:4545–4554. - PMC - PubMed
    1. Aramburu J, Rao A, Klee CB. Calcineurin: from structure to function. Curr Top Cell Regul. 2000;36:237–295. - PubMed
    1. Bailly M, Jones GE. Polarised migration: cofilin holds the front. Curr Biol. 2003;13:R128–R130. - PubMed
    1. Berezovska O, Ramdya P, Skoch J, Wolfe MS, Bacskai BJ, Hyman BT. Amyloid precursor protein associates with a nicastrin-dependent docking site on the presenilin 1-γ-secretase complex in cells demonstrated by fluorescence lifetime imaging. J Neurosci. 2003;23:4560–4566. - PMC - PubMed

Publication types

MeSH terms

LinkOut - more resources