. 2012 Apr 24;109(17):6467-72.
doi: 10.1073/pnas.1107970109. Epub 2012 Apr 11.

Power-law decay of the spatial correlation function in exciton-polariton condensates

Affiliations

Power-law decay of the spatial correlation function in exciton-polariton condensates

Georgios Roumpos et al. Proc Natl Acad Sci U S A. .

Abstract

We create a large exciton-polariton condensate and employ a Michelson interferometer setup to characterize the short- and long-distance behavior of the first order spatial correlation function. Our experimental results show distinct features of both the two-dimensional and nonequilibrium characters of the condensate. We find that the gaussian short-distance decay is followed by a power-law decay at longer distances, as expected for a two-dimensional condensate. The exponent of the power law is measured in the range 0.9-1.2, larger than is possible in equilibrium. We compare the experimental results to a theoretical model to understand the features required to observe a power law and to clarify the influence of external noise on spatial coherence in nonequilibrium phase transitions. Our results indicate that Berezinskii-Kosterlitz-Thouless-like phase order survives in open-dissipative systems.


Conflict of interest statement

The authors declare no conflict of interest.

Figures
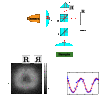
Fig. 1.
Fig. 1.
Michelson interferometer. (A) Schematic of the setup for measurement of the correlation function. The laser is linearly polarized, and we record luminescence of the orthogonal linear polarization through a polarizing beamsplitter (PBS). We then employ a 50-50 nonpolarizing beamsplitter (NPBS), a mirror (M1) and a right-angle prism (M2). The latter creates the reflection of the original image along one axis, depending on the prism orientation. A two-lens microscope setup overlaps the two real space images of the polariton condensate on the camera. (B) Typical interference pattern observed above the polariton condensation threshold along with a schematic showing the orientation of the two overlapping images. (C) Blue circles: measured intensity on one pixel of the camera as a function of the prism (M2) position in normalized units. Red line: fitting to a sine function.
Fig. 2.
Fig. 2.
Phase map measured for laser power (A) below and (B) above the threshold power Pth. The prism in the Michelson interferometer is oriented horizontally. The schematics on the top right of A and B show the orientation of the two interfering images. (C and D) Measured g(1)(x,-x) corresponding to A and B, respectively, averaged over the y axis inside the excitation spot area of 19-μm radius. Blue circles are experimental data. The continuous red and dashed yellow fitting lines are explained in Figs. 3 and 6, respectively.
Fig. 6.
Fig. 6.
(A) g(1)x) vs. Δx for increasing laser power. The laser pumping spot radius is R0 = 19 μm and the threshold power Pth = 55 mW. (B) g(1)x) vs. Δx for one particular laser power and for x both positive (blue circles) and negative (red squares). Dashed line is a power-law fit. (C) Exponent ap of the power-law decay as a function of laser power.
Fig. 3.
Fig. 3.
(A) Decay of g(1)(x,-x) at short distances. Blue dots are experimental data, the red line is a gaussian fit. Data at |x| > 1 μm is noise. (B) Effective de Broglie wavelength λeff as a function of laser pumping power. λeff is extracted from the width of the gaussian fit as shown in A. Blue circles and red squares correspond to orthogonal orientations of the prism in the Michelson interferometer (see text). The condensation threshold is at approximately 55 mW.
Fig. 4.
Fig. 4.
(A) Measured g(1)(x,-xt) for very low pumping power. (B) Measured momentum-space spectrum S(kx,ℏω) for very low pumping power. As explained in the text, g(1)(x,-xt) is the Fourier transform of S(kx,ℏω). (C) Fourier transform of the experimental data shown in B. The result indeed reproduces accurately A. In B and C, the data is plotted in linear color scale in arbitrary units.
Fig. 5.
Fig. 5.
Measured g(1)x) vs. Δx for various pumping spot radii R0. All data is taken above threshold and is chosen such that λeff ∼ 4.1 μm. As the condensate size increases, g(1)x) converges to a power-law decay.

References

    1. Chaikin PM, Lubensky TC. Principles of Condensed Matter Physics. Cambridge Univ Press; 2000.
    1. Pitaevskii L, Stringari S. Bose-Einstein Condensation. Oxford Univ Press; 2003.
    1. Bloch I, Hänsch TW, Esslinger T. Measurement of the spatial coherence of a trapped Bose gas at the phase transition. Nature. 2000;403:166–170. - PubMed
    1. Hadzibabic Z, Dalibard J. Two-dimensional bose fluids: An atomic physics perspective. Rivista del Nuovo Cimento. 2011;34:389.
    1. Hohenberg PC. Existence of long-range order in one and two dimensions. Phys Rev. 1967;158:383–386.

LinkOut - more resources