. 2012 Mar;14(3):228-37.
doi: 10.1593/neo.111570.

Rapamycin inhibits lymphatic endothelial cell tube formation by downregulating vascular endothelial growth factor receptor 3 protein expression

Affiliations

Rapamycin inhibits lymphatic endothelial cell tube formation by downregulating vascular endothelial growth factor receptor 3 protein expression

Yan Luo et al. Neoplasia. 2012 Mar.

Abstract

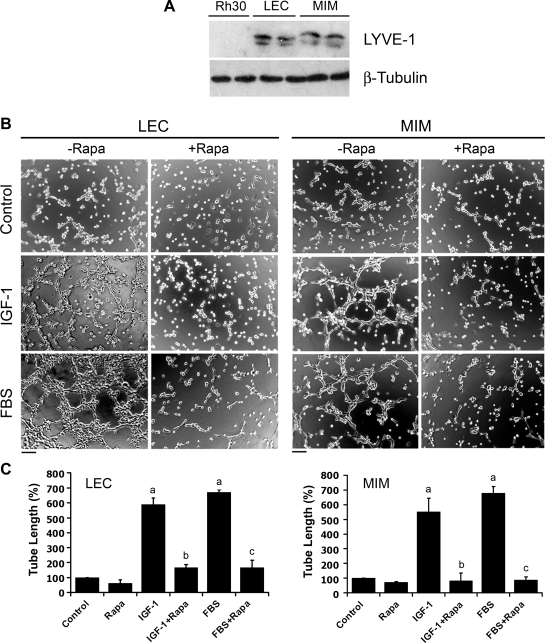
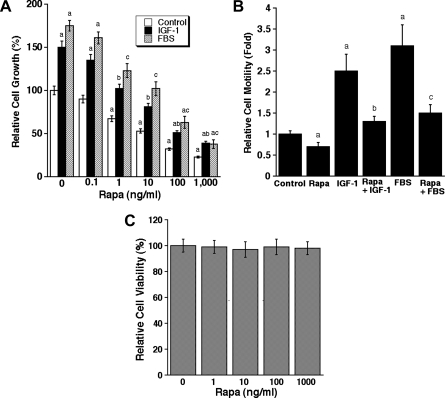
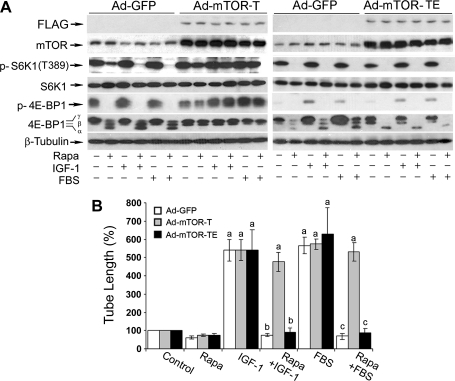
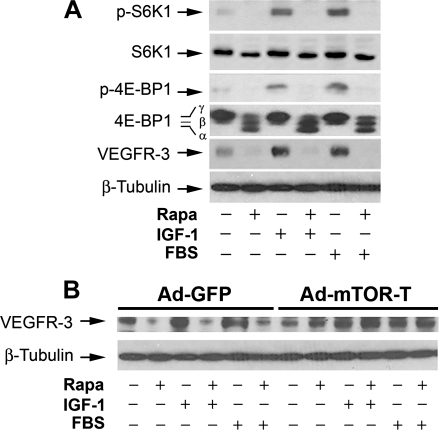
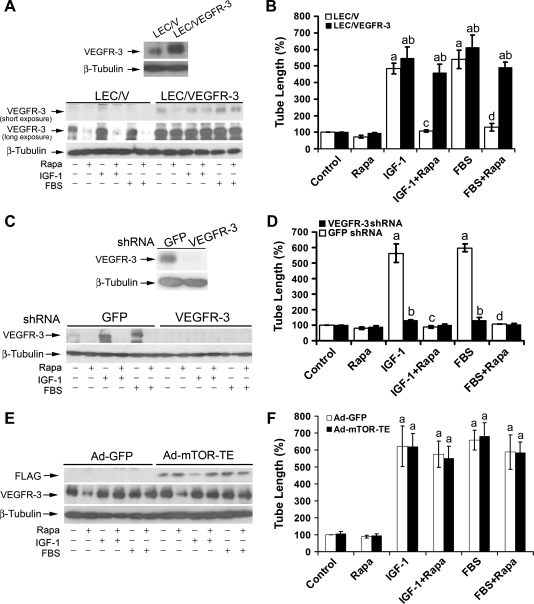
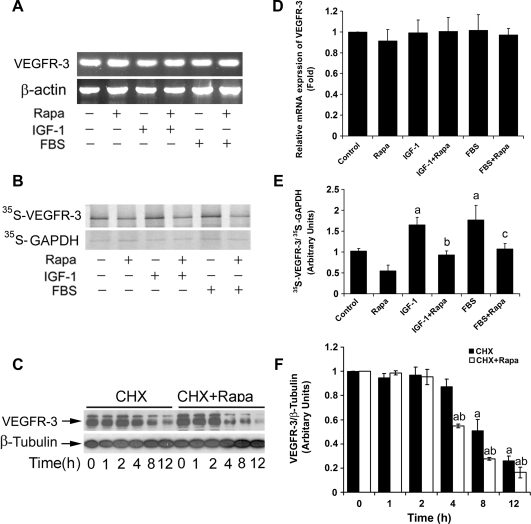
Mammalian target of rapamycin (mTOR) controls lymphangiogenesis. However, the underlying mechanism is not clear. Here we show that rapamycin suppressed insulin-like growth factor 1 (IGF-1)- or fetal bovine serum (FBS)-stimulated lymphatic endothelial cell (LEC) tube formation, an in vitro model of lymphangiogenesis. Expression of a rapamycin-resistant and kinase-active mTOR (S2035T, mTOR-T), but not a rapamycin-resistant and kinase-dead mTOR (S2035T/D2357E, mTOR-TE), conferred resistance to rapamycin inhibition of LEC tube formation, suggesting that rapamycin inhibition of LEC tube formation is mTOR kinase activity dependent. Also, rapamycin inhibited proliferation and motility in the LECs. Furthermore, we found that rapamycin inhibited protein expression of VEGF receptor 3 (VEGFR-3) by inhibiting protein synthesis and promoting protein degradation of VEGFR-3 in the cells. Down-regulation of VEGFR-3 mimicked the effect of rapamycin, inhibiting IGF-1- or FBS-stimulated tube formation, whereas over-expression of VEGFR-3 conferred high resistance to rapamycin inhibition of LEC tube formation. The results indicate that rapamycin inhibits LEC tube formation at least in part by downregulating VEGFR-3 protein expression.


Figures

Figure 1
Figure 1
Rapamycin inhibits IGF-1/FBS-stimulated tube formation in LECs. (A) Cell lysates from indicated cells were subjected to Western blot analysis with the indicated antibodies. (B and C) LEC and MIM cells were treated with rapamycin (Rapa, 100 ng/ml) for 24 hours, in the presence or absence of IGF-1 (10 ng/ml) or 2% FBS, followed by tube formation assay. Representative images are shown in B. Bar, 100 µm. The length of tube-like formation was evaluated by ImageJ software. Quantitative data are presented as mean ± SD (n = 3) in C. aP <.05, difference versus control group. bP < .05, difference versus IGF-1 group. cP < .05, difference versus FBS group.
Figure 2
Figure 2
Rapamycin inhibits proliferation and motility in LECs. (A) LECs, grown in serum-free DMEM/F12 or the medium supplemented with IGF-1 (10 ng/ml) or FBS (10%), were exposed to rapamycin (0-1000 ng/ml) for 72 hours, followed by cell counting using a Beckman Coulter counter. (B) Cell motility of LECs was determined using the single-cell motility assay. (C) LEC viability was evaluated by one-solution assay. Quantitative data are presented as mean ± SD (n = 3) in A to C. aP < .05, difference versus control group. bP < .05, difference versus IGF-1 group. cP < .05, difference versus FBS group.
Figure 3
Figure 3
Rapamycin inhibits LEC tube formation in an mTOR kinase activity-dependent manner. LECs were infected for 24 hours with Ad-GFP, Ad-mTOR-T, and Ad-mTOR-TE, respectively, and then serum-starved for 24 hours. Subsequently, the cells were treated with or without rapamycin (Rapa, 100 ng/ml) for 24 hours, in the presence or absence of IGF-1 (10 ng/ml) or 2% FBS, followed by Western blot analysis with the indicated antibodies (A) or tube formation assay (B). Quantitative data are presented as mean ± SD (n = 3) in B. aP < .05, difference versus control group. bP < .05, difference versus IGF-1 group. cP < .05, difference versus FBS group.
Figure 4
Figure 4
Rapamycin inhibits cellular protein expression of VEGFR-3 in LECs. LECs (A), or LECs infected for 24 hours with Ad-GFP and Ad-mTOR-T, respectively (B), were treated with rapamycin (Rapa, 100 ng/ml) for 24 hours, in the presence or absence of IGF-1 (10 ng/ml) or 2% FBS, followed by Western blot analysis with the indicated antibodies. β-Tubulin was used as a loading control.
Figure 5
Figure 5
Rapamycin inhibits LEC tube formation by downregulating VEGFR-3 protein expression. (A and B) Overexpression of VEGFR-3 confers high resistance to rapamycin inhibition of LEC tube formation. Overexpression of VEGFR-3 was detected in pooled clones of LECs stably transfected VEGFR-3 (LEC/VEGFR-3) but not in the control cells transfected with an empty vector (LEC/V) by Western blot analysis (A, upper panel). LEC/V (control) and LEC/VEGFR-3 cells were treated with rapamycin (Rapa, 100 ng/ml) for 24 hours, in the presence or absence of IGF-1 (10 ng/ml) or 2% FBS, followed by Western blot analysis with the indicated antibodies (A, bottom panel) or tube formation assay (B). Quantitative results of tube formation are shown as mean ± SD (n = 3) in (B). aP <.05, difference versus control group. bP <.05, difference versus LEC/V group. cP < .05, difference versus IGF-1 group. dP < .05, difference versus FBS group. (C and D) Down-regulation of VEGFR-3 mimics the effect of rapamycin, inhibiting IGF-1/FBS-stimulated tube formation. Lentiviral shRNA to VEGFR-3, but not GFP, downregulated VEGFR-3 protein expression in LECs, as detected by Western blot analysis with the indicated antibodies (C, upper panel). LECs, infected with lentiviral shRNAs to VEGFR-3 and GFP (control), respectively, were treated with rapamycin (Rapa, 100 ng/ml) for 24 hours, in the presence or absence of IGF-1 (10 ng/ml) or 2% FBS, followed by Western blot analysis with the indicated antibodies (C, bottom panel) or tube formation assay (D). Quantitative results of tube formation are shown as mean ± SD (n = 3) in D. aP < .05, difference versus control group. bP <.05, difference versus GFP shRNA group. cP < .05, difference versus IGF-1 group. dP <.05, difference versus FBS group. (E and F) Overexpression of VEGFR-3 renders high resistance to rapamycin inhibition of tube formation in LECs expressing mTOR-TE. LEC/VEGFR-3 cells were infected for 24 hours with Ad-GFP and Ad-mTOR-TE, respectively, and then serum starved for 24 hours. Subsequently, the cells were treated with or without rapamycin (Rapa, 100 ng/ml) for 24 hours, in the presence or absence of IGF-1 (10 ng/ml) or 2% FBS, followed by Western blot analysis with the indicated antibodies (E) or tube formation assay (F). Quantitative data are presented as mean ± SD (n = 3) in F. aP < .05, difference versus control group.
Figure 6
Figure 6
Rapamycin does not alter mRNA expression but inhibits protein synthesis and promotes protein degradation of VEGFR-3. (A) Rapamycin did not affect VEGFR-3 mRNA level. Total RNA was extracted from LECs treated with rapamycin (Rapa, 100 ng/ml) for 24 hours in the presence or absence of IGF-1 (10 ng/ml) or 2% FBS, followed by semiquantitative RT-PCR. β-Actin was used as a loading control. (B) Rapamycin inhibited protein synthesis of VEGFR-3 in LECs. LECs were pretreated with rapamycin (Rapa, 100 ng/ml) for 24 hours, in the presence or absence of IGF-1 (10 ng/ml) or 2% FBS, and then pulsed with 35S-Met/Cys for 4 hours, followed by immunoprecipitation with antibodies to VEGFR-3. The immunoprecipitates were separated by SDS-PAGE and transferred to polyvinylidene fluoride membranes, followed by autoradiography. GAPDH served as an internal control. (C) Rapamycin promoted protein degradation of VEGFR-3 in LECs. LECs, grown in 10% FBS-DMEM/F12 medium, were exposed to CHX (50 µg/ml), in the presence or absence of rapamycin (Rapa, 100 ng/ml) for 0 to 12 hours, followed by Western blot analysis with the indicated antibodies. Semiquantitative data for A, B, and C by densitometry using ImageJ are shown in D, E, and F, respectively. Results are means ± SD and are pooled from three independent experiments. aP < .05, difference versus control group. bP < .05, difference versus IGF-1 group. cP < .05, difference versus FBS group. dP < .05, difference versus CHX group.

Similar articles

Cited by

References

    1. Lohela M, Bry M, Tammela T, Alitalo K. VEGFs and receptors involved in angiogenesis versus lymphangiogenesis. Curr Opin Cell Biol. 2009;21:154–165. - PubMed
    1. Raica M, Ribatti D. Targeting tumor lymphangiogenesis: an update. Curr Med Chem. 2010;17:698–708. - PubMed
    1. Proud CG. mTOR signalling in health and disease. Biochem Soc Trans. 2011;39:431–436. - PubMed
    1. Zoncu R, Efeyan A, Sabatini DM. mTOR: from growth signal integration to cancer, diabetes and ageing. Nat Rev Mol Cell Biol. 2011;12:21–35. - PMC - PubMed
    1. Loewith R, Jacinto E, Wullschleger S, Lorberg A, Crespo JL, Bonenfant D, Oppliger W, Jenoe P, Hall MN. Two TOR complexes, only one of which is rapamycin sensitive, have distinct roles in cell growth control. Mol Cell. 2002;10:457–468. - PubMed

Publication types

MeSH terms

Substances

LinkOut - more resources