

Replication fork polarity gradients revealed by megabase-sized U-shaped replication timing domains in human cell lines
- PMID: 22496629
- PMCID: PMC3320577
- DOI: 10.1371/journal.pcbi.1002443
Replication fork polarity gradients revealed by megabase-sized U-shaped replication timing domains in human cell lines
Abstract
In higher eukaryotes, replication program specification in different cell types remains to be fully understood. We show for seven human cell lines that about half of the genome is divided in domains that display a characteristic U-shaped replication timing profile with early initiation zones at borders and late replication at centers. Significant overlap is observed between U-domains of different cell lines and also with germline replication domains exhibiting a N-shaped nucleotide compositional skew. From the demonstration that the average fork polarity is directly reflected by both the compositional skew and the derivative of the replication timing profile, we argue that the fact that this derivative displays a N-shape in U-domains sustains the existence of large-scale gradients of replication fork polarity in somatic and germline cells. Analysis of chromatin interaction (Hi-C) and chromatin marker data reveals that U-domains correspond to high-order chromatin structural units. We discuss possible models for replication origin activation within U/N-domains. The compartmentalization of the genome into replication U/N-domains provides new insights on the organization of the replication program in the human genome.
Conflict of interest statement
The authors have declared that no competing interests exist.
Figures
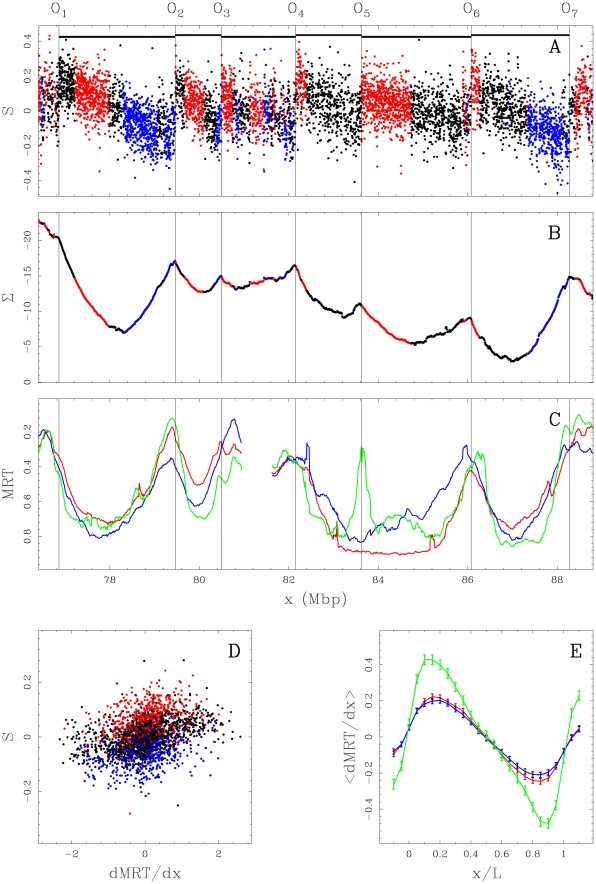
 profile along a 11.4 Mb long fragment of human chromosome 10 that contains 6 skew N-domains (horizontal black bars) bordered by 7 putative replication origins
  to
to  . Each dot corresponds to the skew calculated for a window of 1 kb of repeat-masked sequence. The colors correspond to intergenic (black),
  genes (red) and
  genes (blue). (B) Corresponding cumulative skew profile
  obtained by cumulative addition of
  -values along the sequence. (C) MRT profiles from early, 0 to late, 1 for BG02 (green), K562 (red) and GM06990 (blue) cell lines. (D) Correlations between
  and
and  , in BG02 (100 kb windows) along the 22 human autosomes; colors as in (A); the corresponding Pearson correlations are given in Table 1. (E) Average
  profiles (
 SEM) in the 663 skew N-domains after rescaling their length L to unity; colors as in (C).
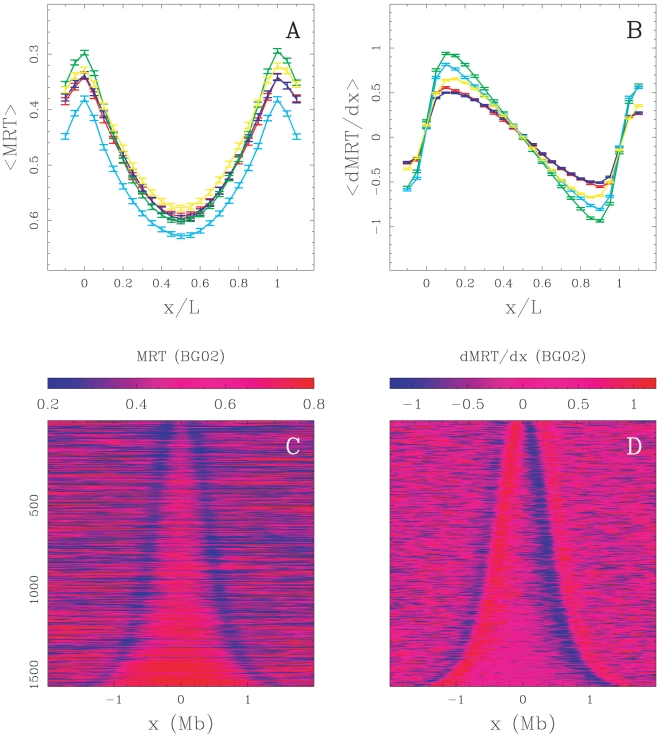
 SEM) inside detected replication U-domains (Table 2). (B) Corresponding average
  profiles (
 SEM). In (A) and (B), each cell line is identified by a color: BG02 (green), K562 (red), GM06990 (blue), BJ R2 (magenta), and HeLa R2 (cyan). (C) The 2534 BG02 U-domains were centered and ordered vertically from the smallest (top) to the longest (bottom). The MRT profile of each domain is figured along a horizontal line using the MRT (BG02) color map. (D) Same as in (C) but for
  using the
  (BG02) color map.
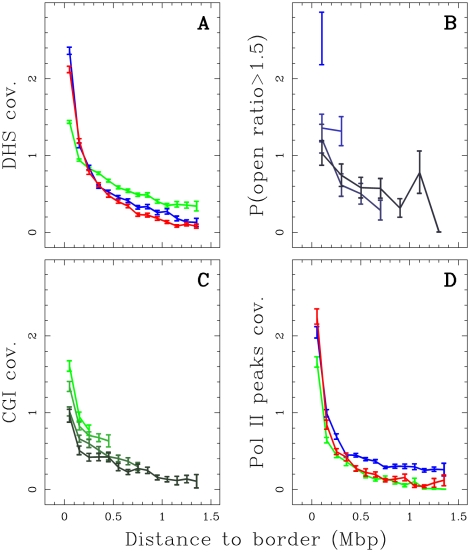
 0.8 Mb, 0.8 Mb
 L
L 1.2 Mb, 1.2 Mb
 L
L 1.8 Mb and 1.8 Mb
 L
L 3 Mb from light to dark blue curves (genome-wide mean value = 0.20). (C) Mean coverage by 1 kb-enlarged CpG islands as a function of the distance to the closest U-domain border in BG02 for the four U-domain size categories defined in (B) from light to dark green curves (genome-wide mean value = 0.0254). (D) Mean coverage by Pol II peaks as a function of the distance to the closest U-domain border in BG02 (green: Pol II in H1 ESC, genome-wide mean value = 0.0026), K562 (red: Pol II in K562, genome-wide mean value = 0.0024), GM06990 (blue: Pol II in GM12878, genome-wide mean value = 0.0097).
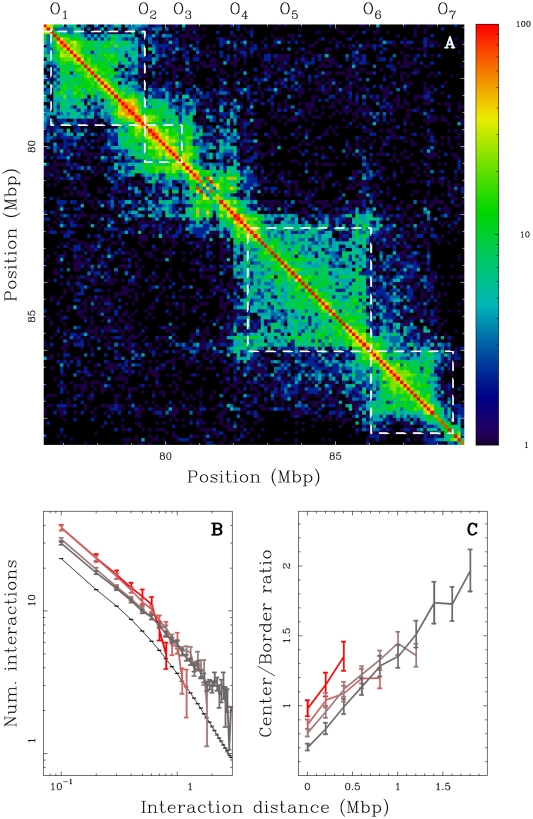
 0.8 Mb, 0.8 Mb
 L
L 1.2 Mb, 1.2 Mb
 L
L 1.8 Mb and 1.8 Mb
 L
L 3 Mb (from light to dark red). (C) Ratio of the number of interactions between two 100 kb loci inside the same U-domain at equal distance from its center and the number of interactions between loci on opposite sides and equal distance from a U-domain border, versus the distance between them; colors as in (B).
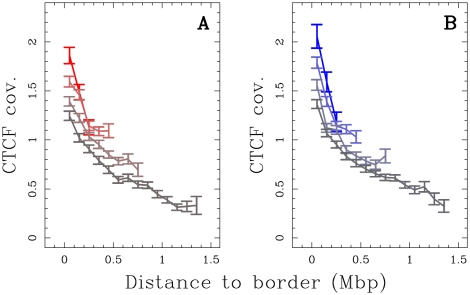
 0.8 Mb, 0.8 Mb
 L
L 1.2 Mb, 1.2 Mb
 L
L 1.8 Mb and 1.8 Mb
 L
L 3 Mb, from light to dark red curves (genome-wide mean value = 0.0051). (B) Same as in (A) but for the GM06990 cell line (blue code shades) (genome-wide mean value = 0.0046).
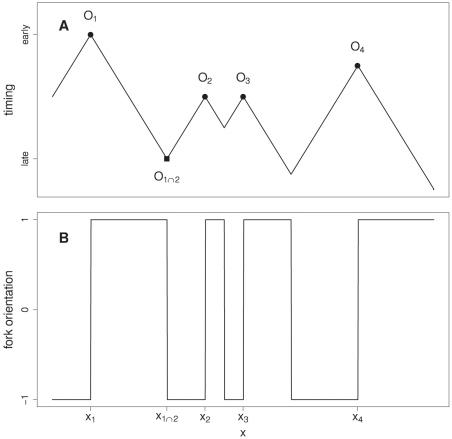
 (A) and fork orientation
  (B) of the configuration
  where
where  corresponds to the origin
  positioned at location
  and firing at time
  . Fork coming from
  meets the fork coming from
  at the space-time point
  defined in Equation (11). The replication timing and fork orientation at the spatial position
  are given by Equation (12) from which we deduce the relationship
  and in turn Equation (14) for the replication fork polarity and the derivative of the MRT. In this picture of the spatio-temporal replication program, the replication fork velocity
  is assumed to be constant and replication is bidirectional from each origin.
References
-
- Berezney R, Dubey DD, Huberman JA. Heterogeneity of eukaryotic replicons, replicon clusters, and replication foci. Chromosoma. 2000;108:471–484. - PubMed
-
- Bell SP, Dutta A. DNA replication in eukaryotic cells. Annu Rev Biochem. 2002;71:333–374. - PubMed
-
- Bogan JA, Natale DA, Depamphilis ML. Initiation of eukaryotic DNA replication: conservative or liberal? J Cell Physiol. 2000;184:139–150. - PubMed
-
- Méchali M. DNA replication origins: from sequence specificity to epigenetics. Nat Rev Genet. 2001;2:640–645. - PubMed
Publication types
MeSH terms
Substances
LinkOut - more resources
Full Text Sources
Other Literature Sources
