

Evolutionary game theory and social learning can determine how vaccine scares unfold
- PMID: 22496631
- PMCID: PMC3320575
- DOI: 10.1371/journal.pcbi.1002452
Evolutionary game theory and social learning can determine how vaccine scares unfold
Abstract
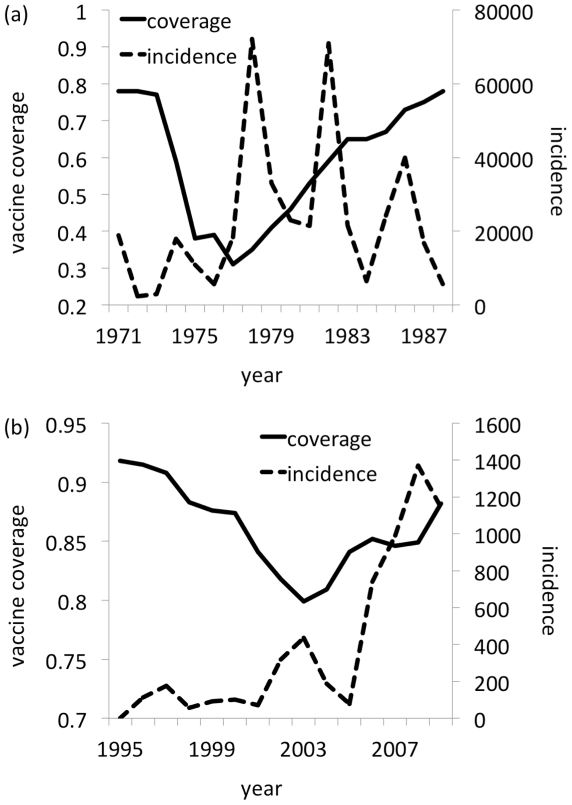
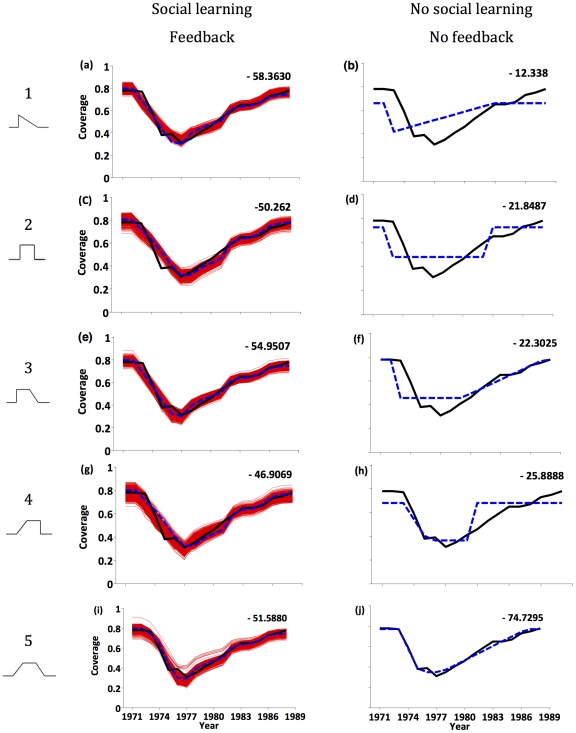
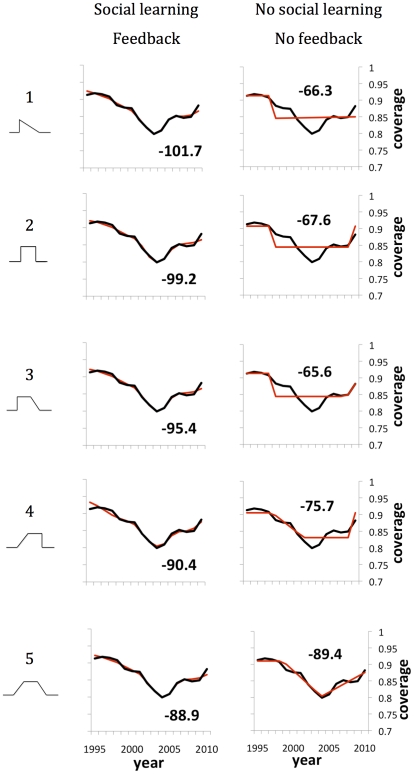
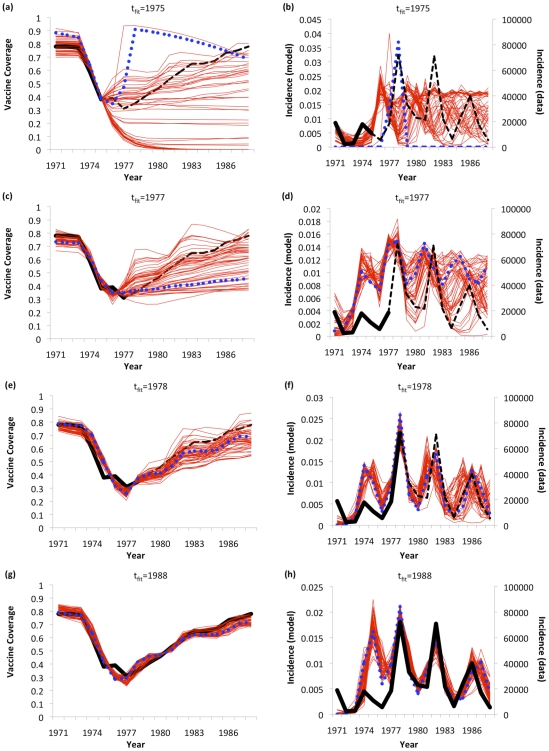
Immunization programs have often been impeded by vaccine scares, as evidenced by the measles-mumps-rubella (MMR) autism vaccine scare in Britain. A "free rider" effect may be partly responsible: vaccine-generated herd immunity can reduce disease incidence to such low levels that real or imagined vaccine risks appear large in comparison, causing individuals to cease vaccinating. This implies a feedback loop between disease prevalence and strategic individual vaccinating behavior. Here, we analyze a model based on evolutionary game theory that captures this feedback in the context of vaccine scares, and that also includes social learning. Vaccine risk perception evolves over time according to an exogenously imposed curve. We test the model against vaccine coverage data and disease incidence data from two vaccine scares in England & Wales: the whole cell pertussis vaccine scare and the MMR vaccine scare. The model fits vaccine coverage data from both vaccine scares relatively well. Moreover, the model can explain the vaccine coverage data more parsimoniously than most competing models without social learning and/or feedback (hence, adding social learning and feedback to a vaccine scare model improves model fit with little or no parsimony penalty). Under some circumstances, the model can predict future vaccine coverage and disease incidence--up to 10 years in advance in the case of pertussis--including specific qualitative features of the dynamics, such as future incidence peaks and undulations in vaccine coverage due to the population's response to changing disease incidence. Vaccine scares could become more common as eradication goals are approached for more vaccine-preventable diseases. Such models could help us predict how vaccine scares might unfold and assist mitigation efforts.
Conflict of interest statement
The authors have declared that no competing interests exist.
Figures

References
-
- Health Protection Agency. Confirmed measles cases in England and Wales-an update. 2008. Available: http://www.hpa.org.uk/hpr/archives/2008/news2508.htm. Accessed 28 February 2012.
-
- Fine P, Clarkson J. Individual versus public priorities in the determination of optimal vaccination policies. Am J Epidemiol. 1986;124:1012–1020. - PubMed
-
- Brito DL, Sheshinski E, Intriligator MD. Externalities and compulsory vaccinations. J Pub Econ. 1991;45:69–90.
-
- Goldstein KP, Philipson TJ, Joo H, Daum RS. The effect of epidemic measles on immunization rates. J Am Med Assoc. 1996;276:56–58. - PubMed
-
- Geoffard P, Philipson T. Disease eradication: private versus public vaccination. Am Econ Rev. 1997;87:222–230.
Publication types
MeSH terms
Grants and funding
LinkOut - more resources
Full Text Sources
Medical
