

Improved statistics for genome-wide interaction analysis
- PMID: 22496670
- PMCID: PMC3320596
- DOI: 10.1371/journal.pgen.1002625
Improved statistics for genome-wide interaction analysis
Abstract
Recently, Wu and colleagues [1] proposed two novel statistics for genome-wide interaction analysis using case/control or case-only data. In computer simulations, their proposed case/control statistic outperformed competing approaches, including the fast-epistasis option in PLINK and logistic regression analysis under the correct model; however, reasons for its superior performance were not fully explored. Here we investigate the theoretical properties and performance of Wu et al.'s proposed statistics and explain why, in some circumstances, they outperform competing approaches. Unfortunately, we find minor errors in the formulae for their statistics, resulting in tests that have higher than nominal type 1 error. We also find minor errors in PLINK's fast-epistasis and case-only statistics, although theory and simulations suggest that these errors have only negligible effect on type 1 error. We propose adjusted versions of all four statistics that, both theoretically and in computer simulations, maintain correct type 1 error rates under the null hypothesis. We also investigate statistics based on correlation coefficients that maintain similar control of type 1 error. Although designed to test specifically for interaction, we show that some of these previously-proposed statistics can, in fact, be sensitive to main effects at one or both loci, particularly in the presence of linkage disequilibrium. We propose two new "joint effects" statistics that, provided the disease is rare, are sensitive only to genuine interaction effects. In computer simulations we find, in most situations considered, that highest power is achieved by analysis under the correct genetic model. Such an analysis is unachievable in practice, as we do not know this model. However, generally high power over a wide range of scenarios is exhibited by our joint effects and adjusted Wu statistics. We recommend use of these alternative or adjusted statistics and urge caution when using Wu et al.'s originally-proposed statistics, on account of the inflated error rate that can result.
© 2012 Ueki, Cordell.
Conflict of interest statement
The authors have declared that no competing interests exist.
Figures
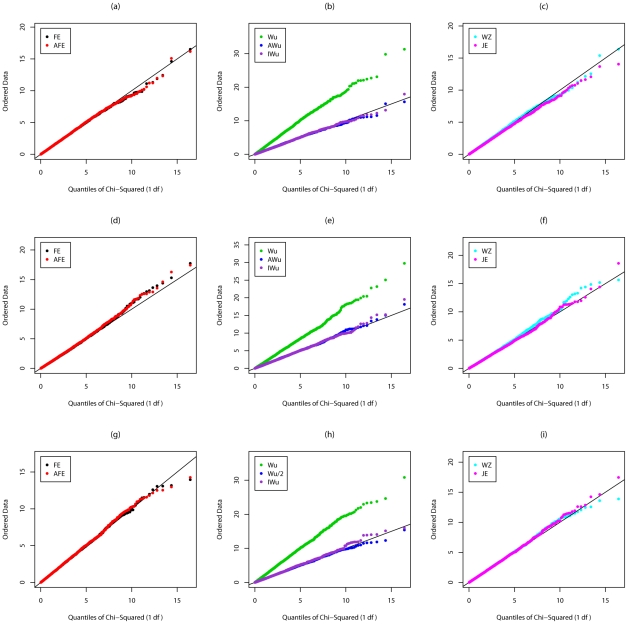
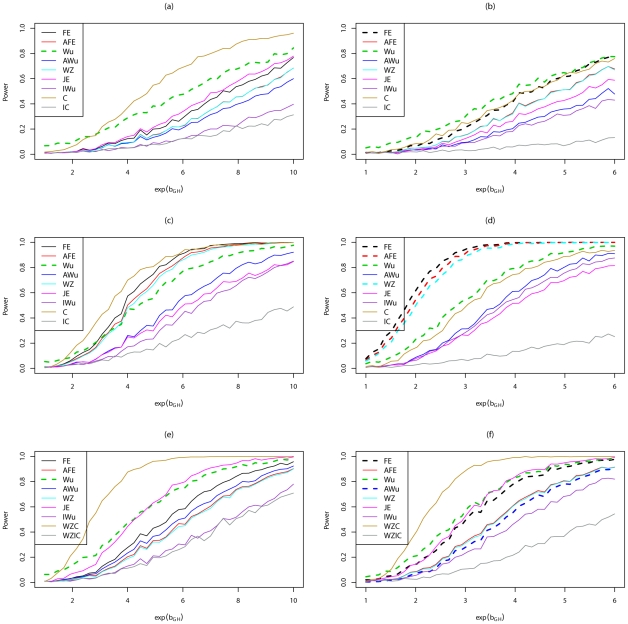
 . Top panels ((a) and (b)): Case/Control not in LD; Middle panels ((c) and (d)): Case/Control in LD; Bottom panels ((e) and (f)): Case-Only not in LD; Left hand panels ((a), (c) and (e)): No main effect; Right hand panels ((b), (d) and (f)): Locus G has main effect; FE: Fast-Epistasis; AFE: Adjusted FE; Wu: Wu et al. statistic; AWu: Adjusted Wu statistic; WZ: Wellek and Ziegler statistic; JE: Joint Effects statistic; IWu: Ideal Wu statistic; C: Logistic regression using correct coding; IC: Logistic regression using incorrect ( = Recessive
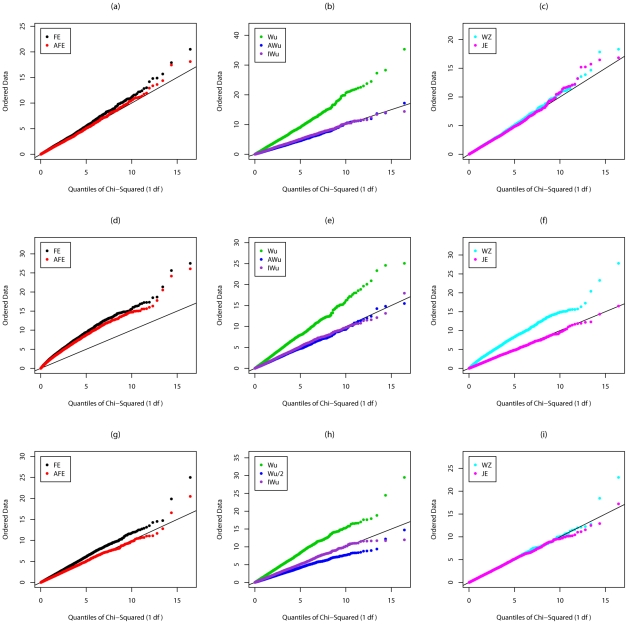
 Dominant) coding; WZC: Wellek and Ziegler case-only statistic using correct coding; WZIC: Wellek and Ziegler case-only statistic using incorrect ( = Recessive
 Dominant) coding.
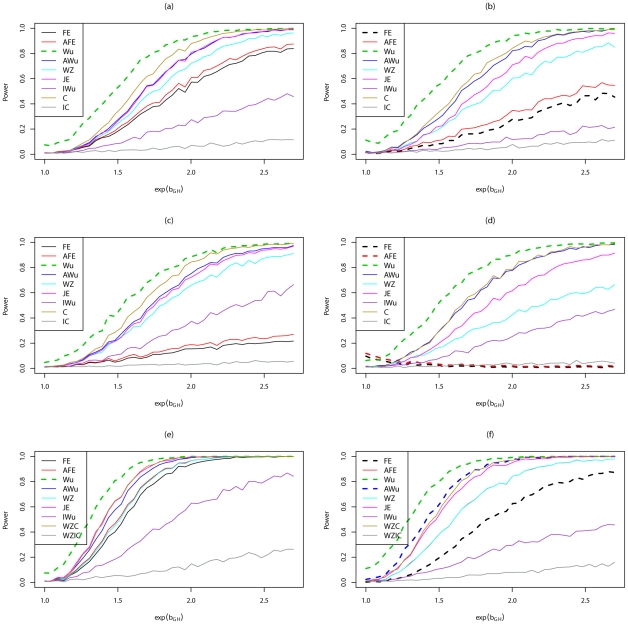
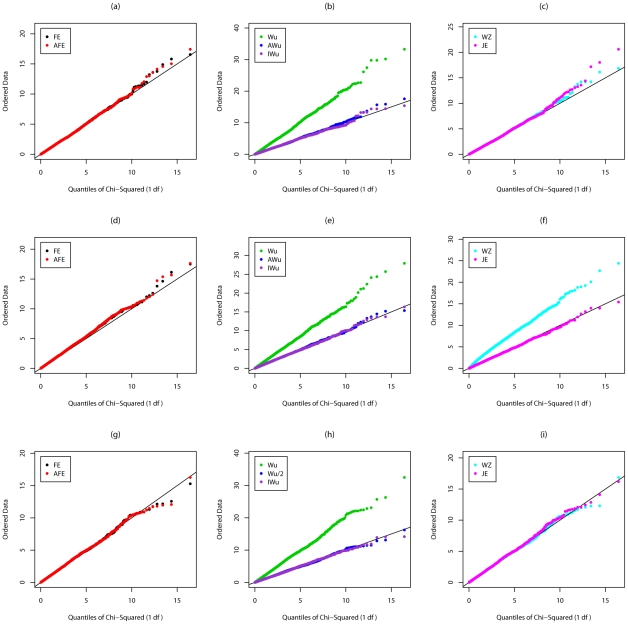
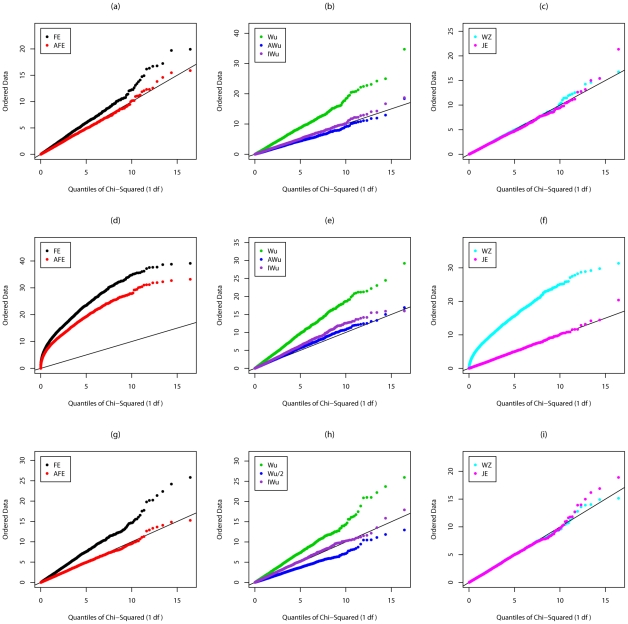
 . Top panels ((a) and (b)): Case/Control not in LD; Middle panels ((c) and (d)): Case/Control in LD; Bottom panels ((e) and (f)): Case-Only not in LD; Left hand panels ((a), (c) and (e)): No main effect; Right hand panels ((b), (d) and (f)): Locus G has main effect; FE: Fast-Epistasis; AFE: Adjusted FE; Wu: Wu et al. statistic; AWu: Adjusted Wu statistic; WZ: Wellek and Ziegler statistic; JE: Joint Effects statistic; IWu: Ideal Wu statistic; C: Logistic regression using correct coding; IC: Logistic regression using incorrect ( = Dominant
 Recessive) coding; WZC: Wellek and Ziegler case-only statistic using correct coding; WZIC: Wellek and Ziegler case-only statistic using incorrect ( = Dominant
 Recessive) coding.
Comment on
-
A novel statistic for genome-wide interaction analysis.PLoS Genet. 2010 Sep 23;6(9):e1001131. doi: 10.1371/journal.pgen.1001131. PLoS Genet. 2010. PMID: 20885795 Free PMC article.
Similar articles
-
A novel genome-information content-based statistic for genome-wide association analysis designed for next-generation sequencing data.J Comput Biol. 2012 Jun;19(6):731-44. doi: 10.1089/cmb.2012.0035. Epub 2012 May 31. J Comput Biol. 2012. PMID: 22651812 Free PMC article.
-
From interaction to co-association --a Fisher r-to-z transformation-based simple statistic for real world genome-wide association study.PLoS One. 2013 Jul 29;8(7):e70774. doi: 10.1371/journal.pone.0070774. Print 2013. PLoS One. 2013. PMID: 23923021 Free PMC article.
-
To control false positives in gene-gene interaction analysis: two novel conditional entropy-based approaches.PLoS One. 2013 Dec 10;8(12):e81984. doi: 10.1371/journal.pone.0081984. eCollection 2013. PLoS One. 2013. PMID: 24339984 Free PMC article.
-
A cost-effective statistical method to correct for differential genotype misclassification when performing case-control genetic association.Hum Hered. 2010;70(2):102-8. doi: 10.1159/000314470. Epub 2010 Jul 3. Hum Hered. 2010. PMID: 20606457
-
Subgroup analyses in randomised controlled trials: quantifying the risks of false-positives and false-negatives.Health Technol Assess. 2001;5(33):1-56. doi: 10.3310/hta5330. Health Technol Assess. 2001. PMID: 11701102 Review.
Cited by
-
Additive, epistatic, and environmental effects through the lens of expression variability QTL in a twin cohort.Genetics. 2014 Feb;196(2):413-25. doi: 10.1534/genetics.113.157503. Epub 2013 Dec 2. Genetics. 2014. PMID: 24298061 Free PMC article.
-
Epi2Loc: an R package to investigate two-locus epistatic models.Twin Res Hum Genet. 2014 Aug;17(4):272-8. doi: 10.1017/thg.2014.38. Epub 2014 Jul 1. Twin Res Hum Genet. 2014. PMID: 24983251 Free PMC article.
-
Learning epistatic polygenic phenotypes with Boolean interactions.PLoS One. 2024 Apr 16;19(4):e0298906. doi: 10.1371/journal.pone.0298906. eCollection 2024. PLoS One. 2024. PMID: 38625909 Free PMC article.
-
A Novel Test for Detecting SNP-SNP Interactions in Case-Only Trio Studies.Genetics. 2016 Apr;202(4):1289-97. doi: 10.1534/genetics.115.179846. Epub 2016 Feb 10. Genetics. 2016. PMID: 26865367 Free PMC article.
-
Further investigations of the W-test for pairwise epistasis testing.Wellcome Open Res. 2017 Jul 21;2:54. doi: 10.12688/wellcomeopenres.11926.1. eCollection 2017. Wellcome Open Res. 2017. PMID: 28852712 Free PMC article.
References
-
- Wu X, Dong H, Luo L, Zhu Y, Peng G, et al. A novel statistic for genome-wide interaction analysis. PLoS Genet. 2010;6:e1001131. doi: 10.1371/journal.pgen.1001131. - DOI - PMC - PubMed
Publication types
MeSH terms
Grants and funding
LinkOut - more resources
Full Text Sources
Miscellaneous
